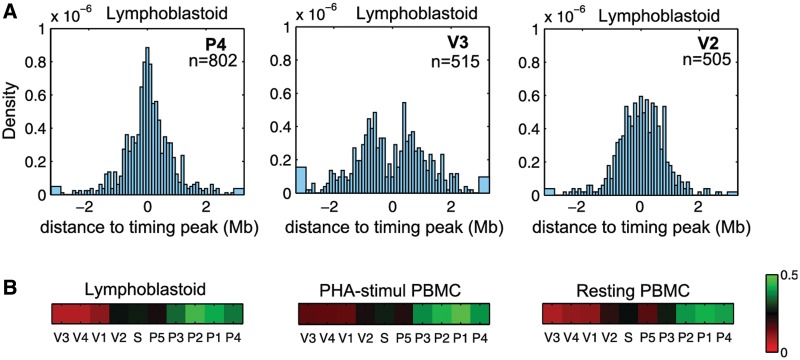
Figure 3.
Viewpoints localized on local timing peaks mostly interact with other timing-peaked regions. (A) Histograms of the distance between every 4C peak and the closest timing peak on the whole genome. 4C peaks were detected in the whole genome, we then measured the distance between each of them and the closest timing peak. The three histograms represent theses distances measured in lymphoblastoid cells for P4 (left), V3 (middle) and V2 (right) viewpoints. A distribution centered on zero (P4) indicated that the 4C peaks are close to timing peaks. n = number of 4C peaks detected. (B) We computed the percentage of distances <250 kb and represented this value with a green–red color map. 4C signals in phase with the replication timing are green (P4) whereas anti-correlated signals are red (V3).

