Figure 4.
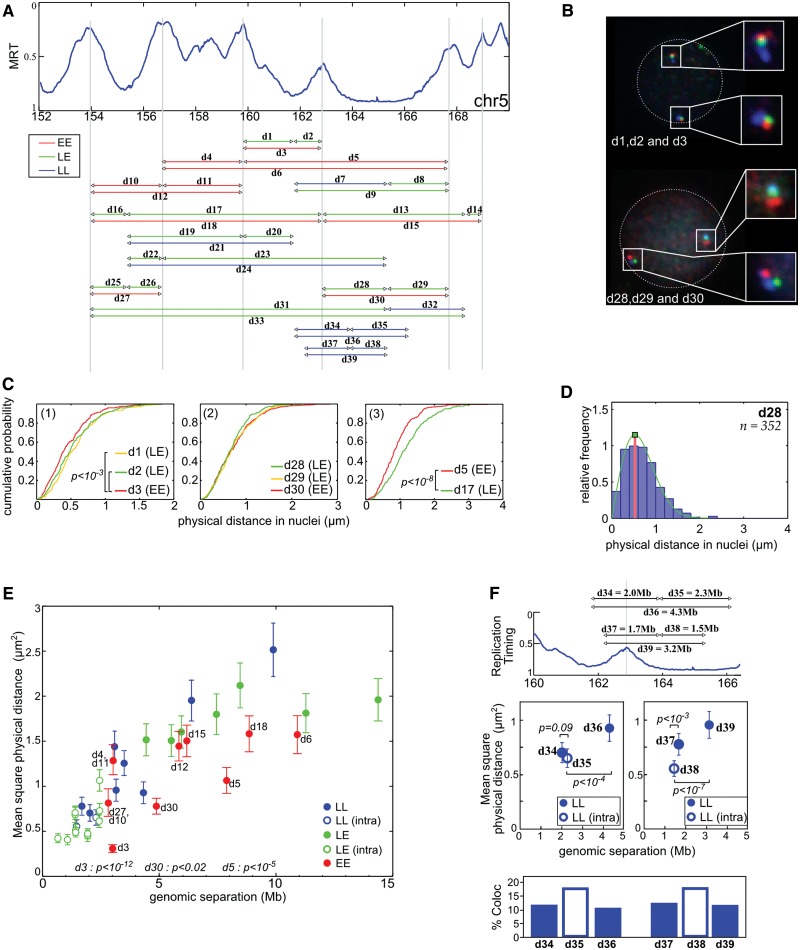
FISH distance measurements confirm the physical proximity between early replicated regions. (A) Physical distances measured by three colors FISH in resting PBMC. The arrowheads correspond to the positions of the used probes (Supplementary Table S2), and the line to the measured distances. Three sets of measurements were performed: EE between two timing peaks, LL between two timing valleys and LE between a timing peak and a timing valley. (B) Example of FISH images in resting PBMC nuclei (d1 = GB, d2 = BR, d3 = GR, d28 = BR, d29 = GR, d30 = GB). On both chromosomes, the physical distances separating the gravity centers of the spots were measured in PBMC nuclei. (C) Cumulative distance measurements. (1) d3 (3 Mb) is slightly smaller than d1 (1.9 Mb) and d2 (1.1 Mb, P < 10−3, Student’s t-test). (2) d28, d29, d30 have the same physical distance even if d30 is 5 Mb and d28/d29 are ∼2.5 Mb. (3) d5 is smaller than d17 even if they both cover 7.6 Mb (P < 10−8, Student’s t-test). (D) Relative frequency histograms of d28 distance (2.5 Mb). The green lines correspond to the fit of the frequency histograms by a Rayleigh law (see ‘Materials and Methods’ section). (E) Mean squared physical distance ±95% confidence interval (see ‘Materials and Methods’ section and (47)) as a function of the genomic separation. Red dots, measurement between two timing peaks (EE); blue, between two late regions (LL); green, between a peak and a timing valley (LE). Open dots correspond to distances measured inside a single replication domain; close dots correspond to distances measured between different replication domains. Here, a replication domain is defined by its two timing peak borders surrounding a late-replicated core. P-values shown are evaluated for few EE distances and correspond to pairwise Student’s t-tests with other measured distances with similar (±15%) genomic separation. (F) Physical distances and interaction frequencies between two probes localized within the same replication domain or between two adjacent replication domains. Top: corresponding distances. Middle: as in (E). Bottom: percentage of cases where measured distances are <0.3 µm. P-values correspond to pairwise Student’s t-tests.

