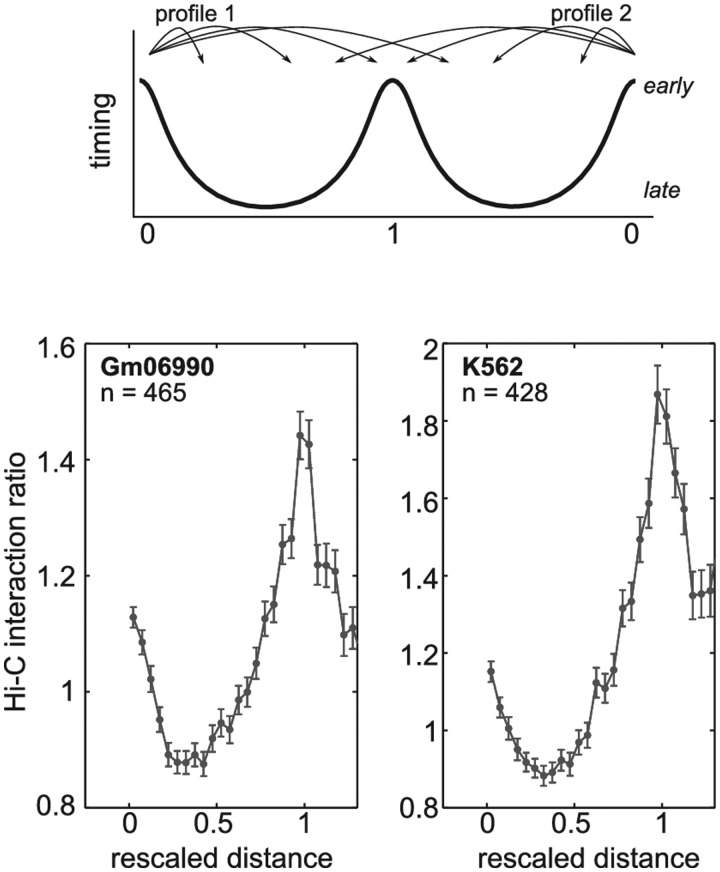
Figure 5.
Hi–C interaction profile across timing peaks. Average Hi–C interaction ratio across timing peaks localized at the border between two consecutive U-domains (top, see ‘Materials and Methods’ section). Bottom, the mean interaction ratio profile as a function of the genomic distance rescaled so that U-domain size be 1. It corresponds to an average over n = 465 (respectively, n = 428) timing peaks in Gm06990 (respectively, K562) cell line.

