Figure 2.
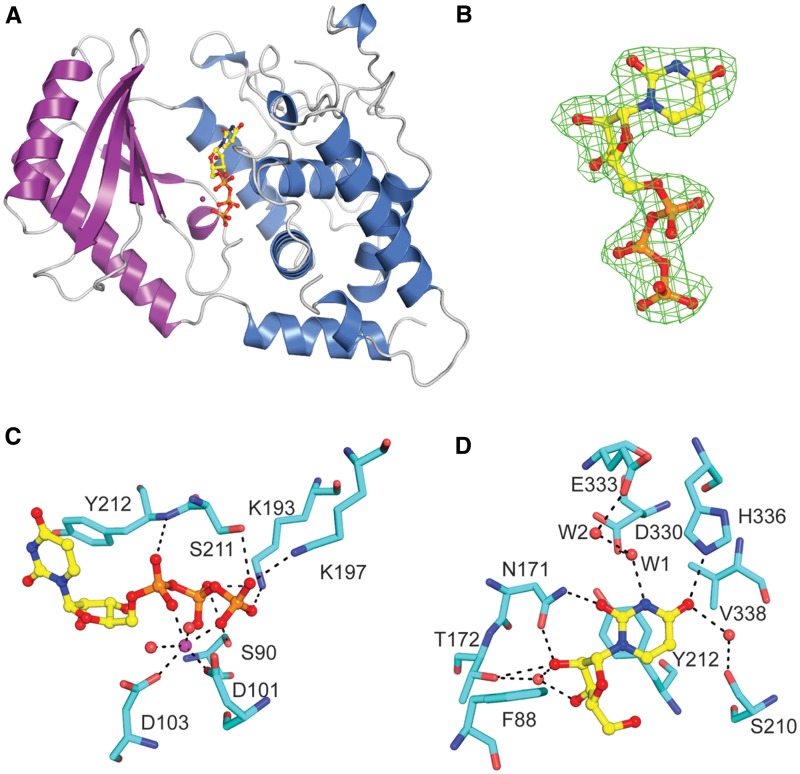
Structure of Cid1–MgUTP complex. (A) Overview of Cid1–MgUTP structure. UTP binds into a cleft between the catalytic and central domains of Cid1. UTP is shown in ball and stick representation, Cid1 is shown as ribbon representation. (B) UTP molecule from Cid1–MgUTP structure with a Fo − Fc omitted map (green mesh) contoured at 3 σ. (C) Cid1 recognition of Mg2+ and triphosphate moieties of UTP. Mg2+shown as sphere. (D) Key ribose/base interactions between Cid1 and UTP.

