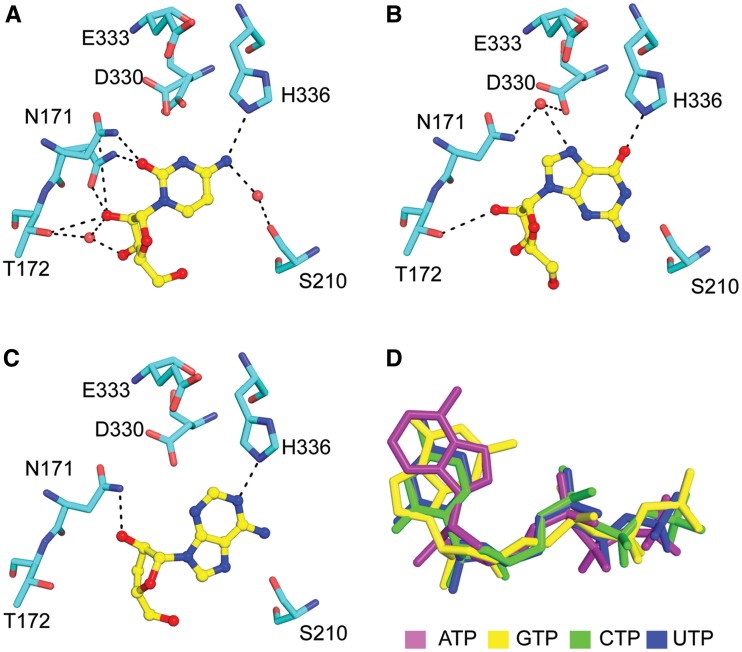
Figure 3.
NTP recognition by Cid1. Key ribose–base interactions observed for (A) Cid1–CTP recognition; (B) Cid1–GTP recognition and (C) Cid1-3′-dATP recognition. (D) Relative positioning of NTPs in the active site after superpositioning each of the Cid1–NTP structures. For panels A–C coloring is same as Figure 2, coloring for NTPs in panel D is indicated in the figure.

