FIGURE 6.

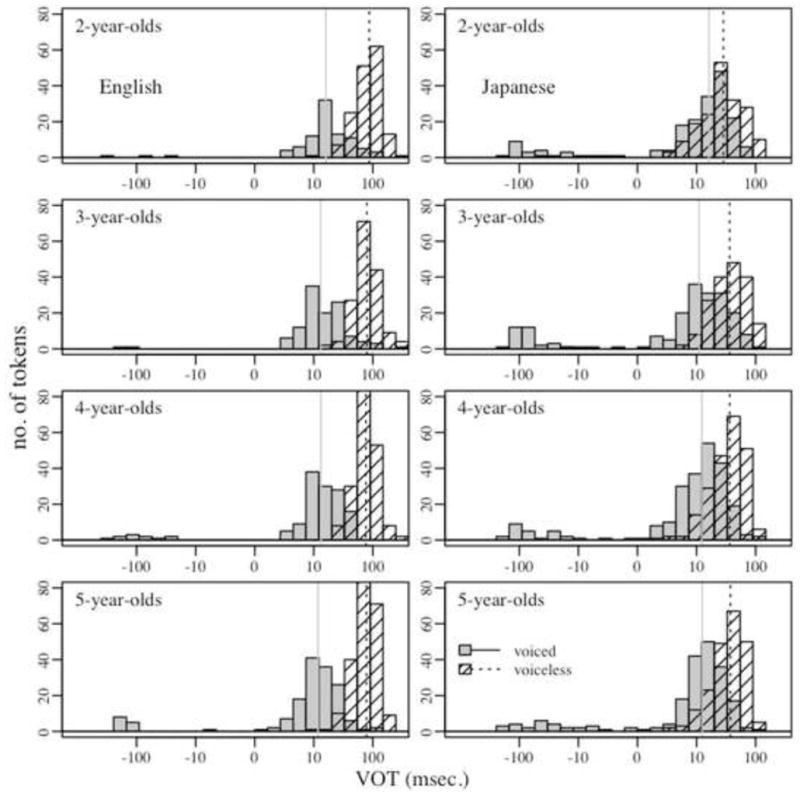
Histograms of English and Japanese stop VOT values separated into the four different age groups (2;0–2;11, 3;0–3;11, 4;0–4;11 and 5;0–5;11). Vertical lines indicate the median VOT for voiced/voiceless stops in each age group.

Histograms of English and Japanese stop VOT values separated into the four different age groups (2;0–2;11, 3;0–3;11, 4;0–4;11 and 5;0–5;11). Vertical lines indicate the median VOT for voiced/voiceless stops in each age group.