
FIGURE 6.
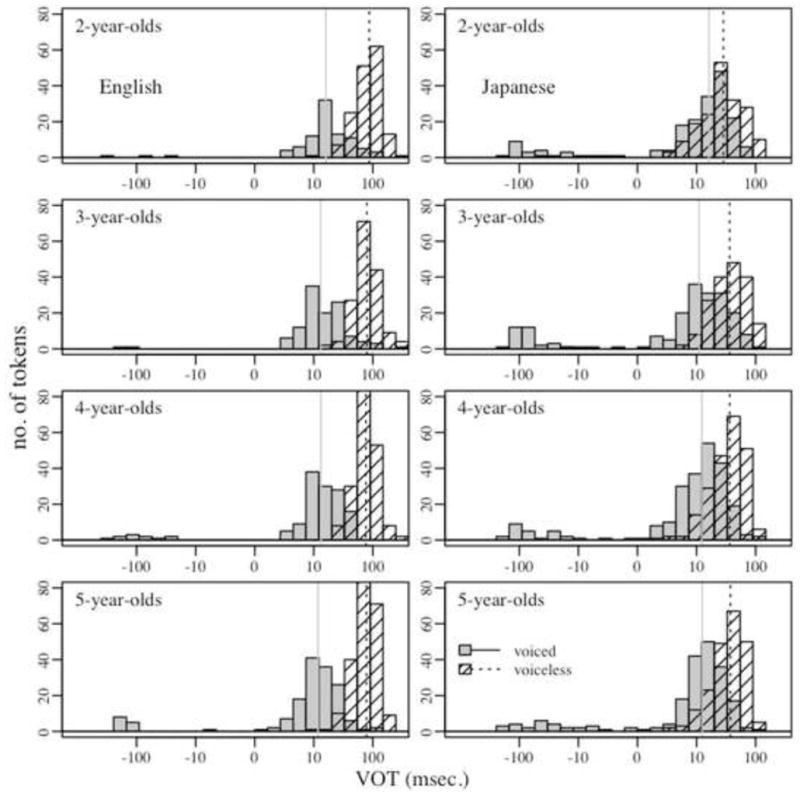
Histograms of English and Japanese stop VOT values separated into the four different age groups (2;0–2;11, 3;0–3;11, 4;0–4;11 and 5;0–5;11). Vertical lines indicate the median VOT for voiced/voiceless stops in each age group.
Official websites use .gov
A
.gov website belongs to an official
government organization in the United States.
Secure .gov websites use HTTPS
A lock (
) or https:// means you've safely
connected to the .gov website. Share sensitive
information only on official, secure websites.
Histograms of English and Japanese stop VOT values separated into the four different age groups (2;0–2;11, 3;0–3;11, 4;0–4;11 and 5;0–5;11). Vertical lines indicate the median VOT for voiced/voiceless stops in each age group.