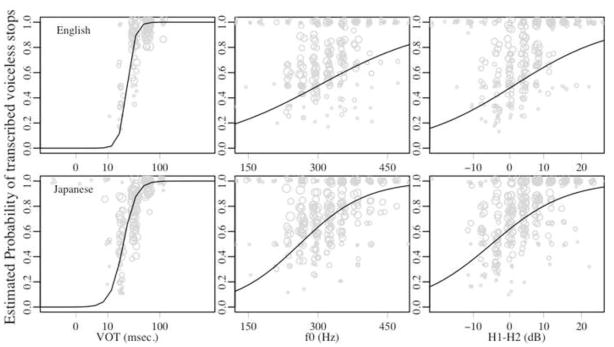
FIGURE 7.
The estimated probability of the transcribed voiceless stops vs. voiced stops with respect to VOT, f0 and H1-H2. The overlaid curves were the model fits of the mixed-effects logistic regression models of English- and Japanese-speaking children’s productions. Each data point of the scatter plots indicates the proportion of voiceless stops for a given acoustic values produced by individual speakers. The estimated probability of ‘1’ indicates the production was transcribed as voiceless, whereas ‘0’ indicates that it was transcribed as voiced. The exact coefficient values are shown in Table 5.

