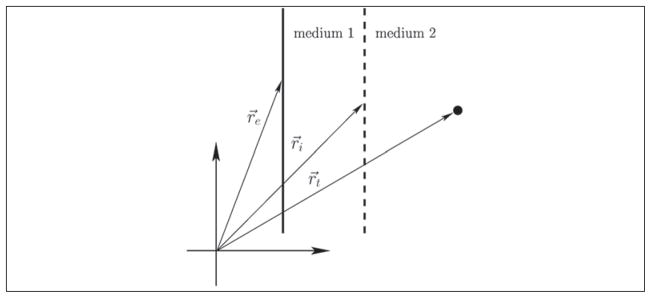
Figure 5.
This figure demonstrates the geometry for calculating the two-layer delay profile. The solid line shows the position of the transducer whose element positions are described by re, where j indexes the transducer element. There is an interface position for each element position, which is described by ri. The lateral component of ri is what is actually found by finding the roots of equation (7). The wave’s point of origin is described by rt.

