FIG. 2.
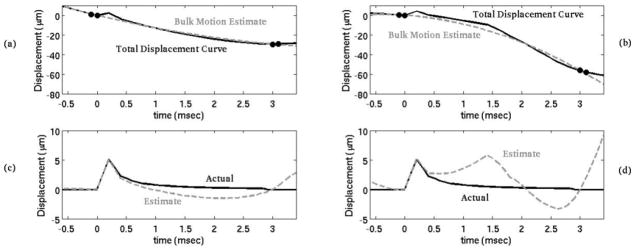
In the top plots (a, b), the black line is the total displacement curve, containing both the physiological motion and displacement due to a simulated acoustic radiation force. The gray dotted line is an estimate of the physiological motion using a temporal interpolation motion filter. The black dots represent the points used for the motion filter. By subtracting the bulk motion estimate from the total displacement curve, the displacement due to the acoustic radiation force is isolated (c, d). (a) and (c) demonstrate a case in which the motion filter is effective while (b) and (d) demonstrates a less effective case.

