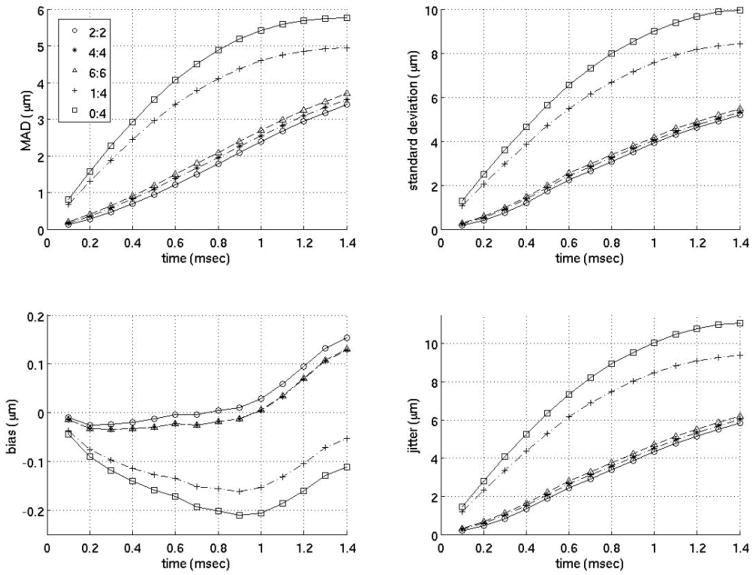
FIG. 3.
Interpolation motion filter. Plots of the mean absolute difference (MAD), standard deviation of the MAD (STD), bias and standard deviation of the bias (jitter) for an interpolation motion filter as a function of time after ARFI push. As an example, 2:2 in the legend indicates the filter used 2 prereference tracks immediately before the reference line and 2 postrecovery tracks immediately after full tissue recovery to fit the quadratic estimate of the physiological motion. (1:4 is the filter used by Bradway et al9 and 0:4 is the filter used by Hsu et al.10)

