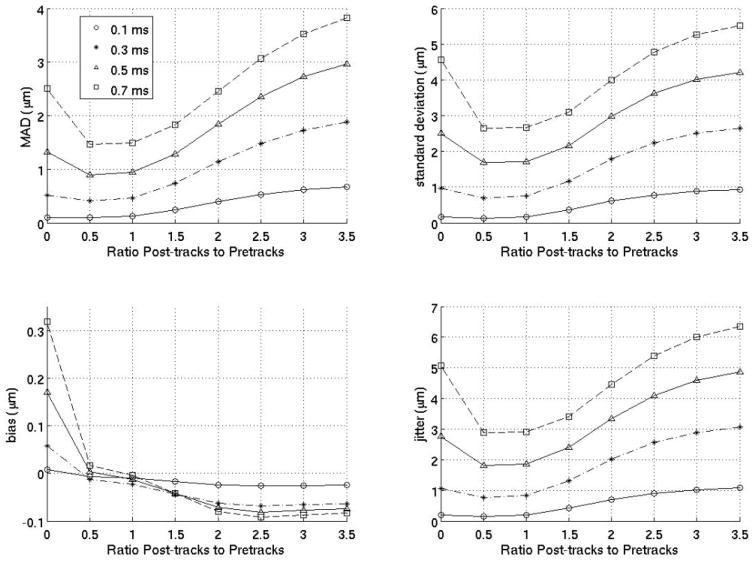
FIG. 4.
Interpolation motion filter. Plots for an interpolation motion filter as a function of the ratio of postrecovery tracks to prereference tracks at various times (either 0.1,0.3,0.5 or 0.7 ms) after the ARFI push. The number of prereference tracks was held constant at 2, so, for example, a ratio of 1.5 means the filter used three postrecovery tracks immediately after tissue recovery and three prereference tracks immediately prior to the ARFI push.

