
Figure 2.
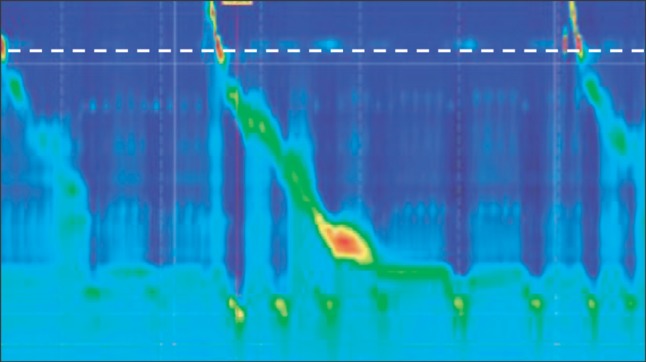
High-resolution esophageal manometry contour plot demonstrating a hypotensive upper esophageal sphincter (UES). The white dashed line shows the position of the UES.
Official websites use .gov
A
.gov website belongs to an official
government organization in the United States.
Secure .gov websites use HTTPS
A lock (
) or https:// means you've safely
connected to the .gov website. Share sensitive
information only on official, secure websites.
High-resolution esophageal manometry contour plot demonstrating a hypotensive upper esophageal sphincter (UES). The white dashed line shows the position of the UES.