Figure 5.

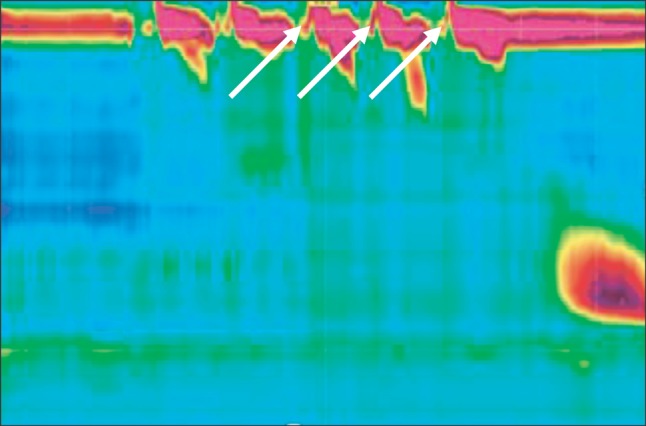
High-resolution esophageal manometry contour plot demonstrating a cricopharyngeal bar. The white arrows show raised intrabolus pressure.

High-resolution esophageal manometry contour plot demonstrating a cricopharyngeal bar. The white arrows show raised intrabolus pressure.