
Figure 6.
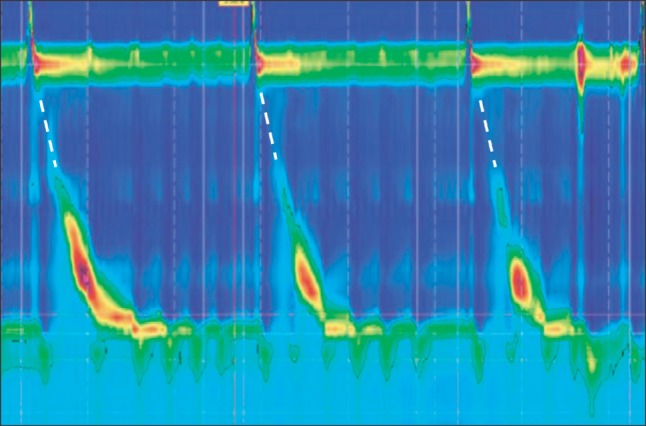
High-resolution esophageal manometry contour plot demonstrating absent proximal esophageal contraction. The white dashed lines show the usual position of proximal esophageal contractions.
Official websites use .gov
A
.gov website belongs to an official
government organization in the United States.
Secure .gov websites use HTTPS
A lock (
) or https:// means you've safely
connected to the .gov website. Share sensitive
information only on official, secure websites.
High-resolution esophageal manometry contour plot demonstrating absent proximal esophageal contraction. The white dashed lines show the usual position of proximal esophageal contractions.