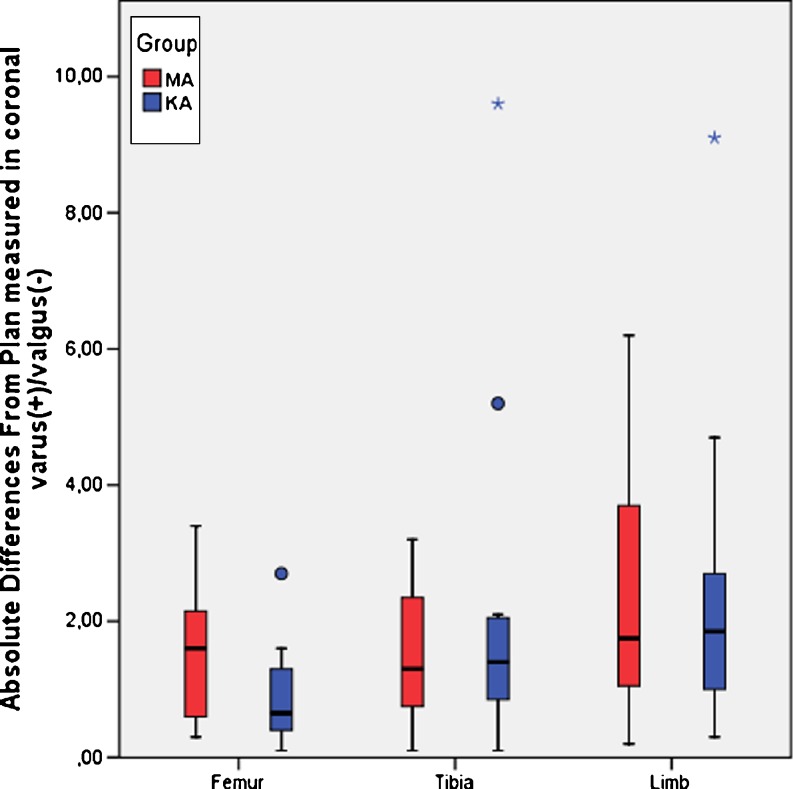
Fig. 4.
Absolute differences from plan in varus(+)/valgus(-) between MA and KA method for femur, tibia and overall limb. The rectangular boxes represent the inter-quartile ranges (25th to 75th percentile). Outliers (between 1.5 to 3 inter-quartile ranges away from the upper/lower limits of the box) are marked as circles, extreme values (more than three inter-quartile ranges away from the upper/lower limits of the box) as stars

