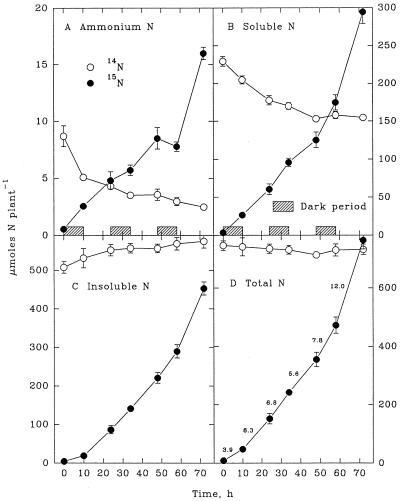
Figure 3.
Whole-plant contents of NH4+ (A), soluble N (B), insoluble N (C), and total N (D) derived from endogenous (14N) sources and from exogenously supplied NH4+ (15N) during a 3-d continuous exposure of maize seedlings to highly labeled 15NH4+. Each value is the mean of four replicates ± se. The diurnal rates of 15NH4+ uptake (in micromoles per gram fresh weight per hour) are noted in D.

