
Figure 3. Analysis of ASS1 protein expression using tissue microarray (TMA).
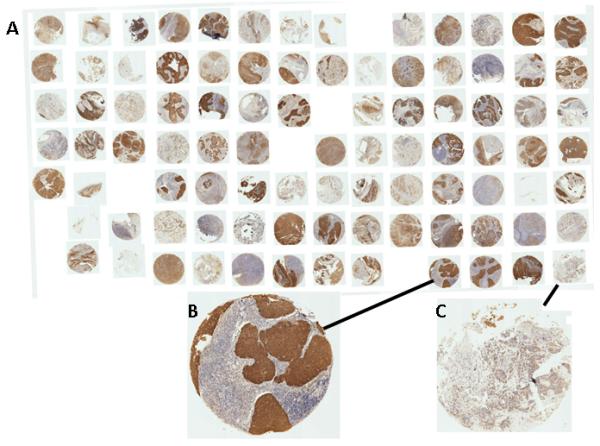
A total of 36 OPCs are represented in duplicate on the TMA. Of these tumors, 12 were HPV−, 21 HPV+ and 3 had unknown HPV status. Panel A represents the full TMA, Panel B is an example of an ASS1-positive OPC and Panel C an example of an ASS1-negative OPC.