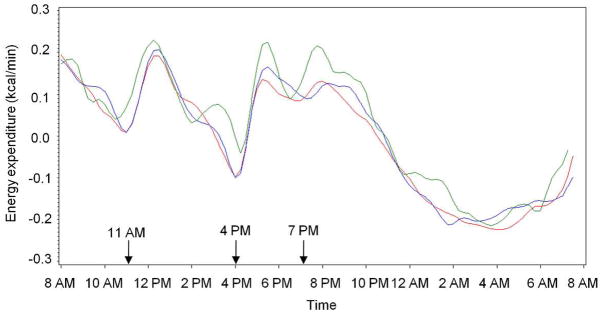
Figure 1.
Energy expenditure over 24 hrs adjusted for age, sex, fat mass, fat free mass, and activity based on genotypes for rs2025804. Twenty four hour energy expenditure was measured by indirect calorimetry in a metabolic chamber. Oxygen consumption and carbon dioxide production were measured and energy expenditure calculated over 15 minute intervals. Arrows indicate when meals were given. Red line, homozygous G/G (n = 167); blue line, heterozygous G/A (n = 110); green line, homozygous A/A (n = 26).

