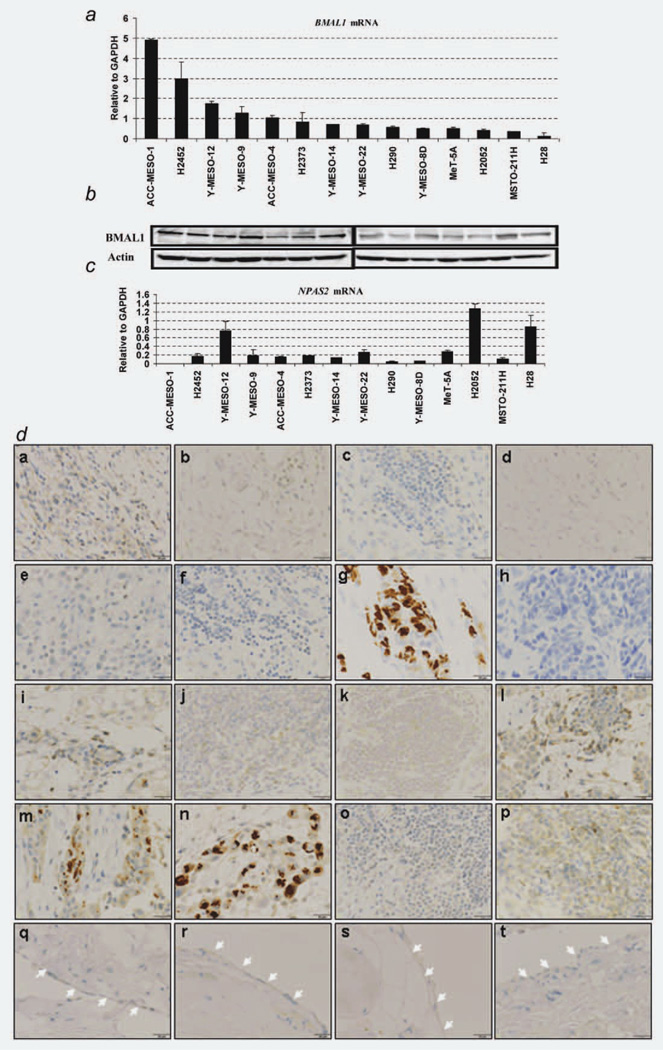
Figure 1.
BMAL1 expression levels in MPM and normal parietal pleura. (a) qRT-PCR analysis of BMAL1 in 13 MPM cell lines and an immortalized pleural mesothelial cell line MeT-5A (control). The cell lines are aligned by expression levels of BMAL1 mRNA from high (left) to low (right). The result is a representative of two independent qRT-PCR experiments done in duplicated reactions. (b) Western blots of BMAL1 in MPM cell lines. Actin was used as a loading control. (c) qRT-PCR analysis of NPAS2 in 13 MPM cell lines and MeT-5A. (d) Immunohistochemical staining of BMAL1 in surgically annotated MPM and normal parietal pleural specimens. Immunohistochemical analysis showed an overexpression of BMAL1 in a subset of MPM specimen (a–p), whereas normal pleural mesothelial cells showed negative BMAL1 immunoreactivity (white arrows, q–t). Details of MPM and normal parietal pleural specimens were mentioned in “Material and Methods” Section. ×400 magnification and 25 µm scale bars were used for all images. [Color figure can be viewed in the online issue, which is available at wileyonlinelibrary.com.]

