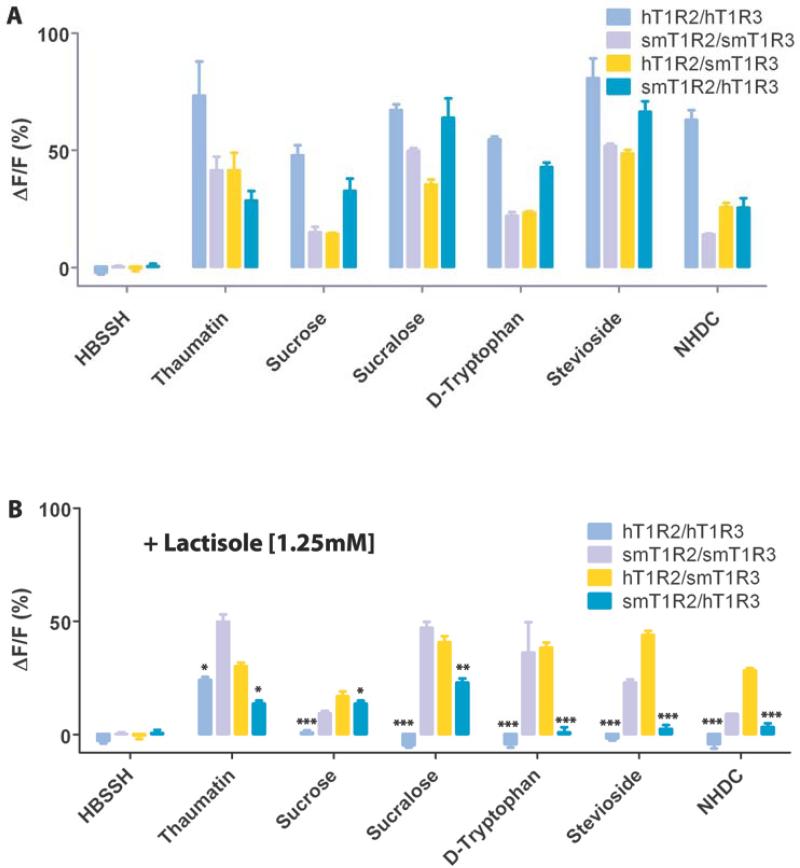
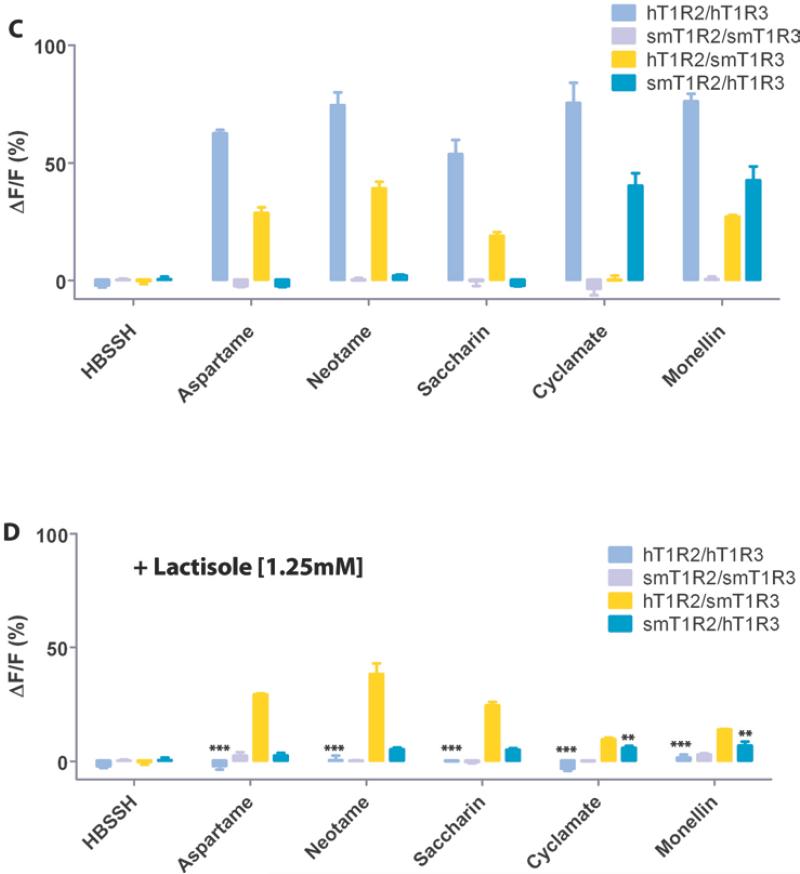
Fig. 2.
Human and squirrel monkey T1R2/T1R3 selectively respond to sweet taste stimuli with/without lactisole present. (A) The responses of the cells to HBSSH (buffer solution), thaumatin, sucrose, sucralose, D-tryptophan, stevioside, and NHDC were assayed by calcium mobilization. (B) Same as (A) with lactisole (1.25mM) present. (C) The responses of the cells to HBSSH, aspartame, neotame, saccharin, cyclamate and monellin. (D) Same as (C) with lactisole (1.25mM) present. F is the base-line level of fluorescence, and ΔF is the change in fluorescence from the base-line level (peak-base line). Data are expressed as the mean ± S.E. of the ΔF/F values from three independent experiments. Lactisole reduced the overall responses of the receptors. For comparison, the signals in panels (B) and (D) were amplified by a factor of 1.31 based on the smT1R2/smT1R3 response to sucralose with (39.6%) and without (52%) lactisole present. The asterisks indicate significant differences tested by unpaired Student's test (*: p<0.05; **: p<0.01; ***: p<0.001) compared with the receptor responses without lactisole.


