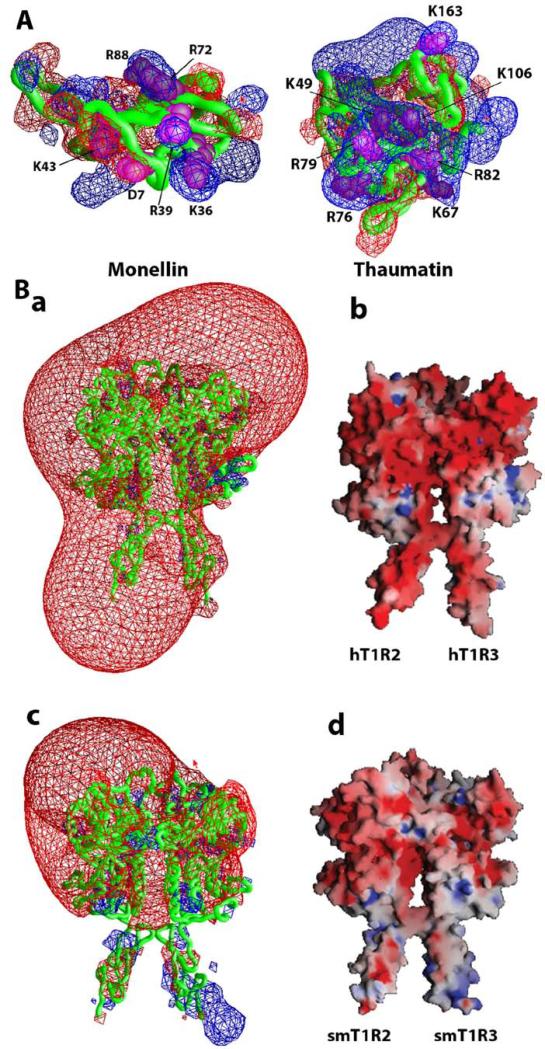
Fig. 4.
Electrostatic properties of sweet-tasting proteins and human/squirrel monkey T1R2 and T1R3. (A) Electrostatic potentials contour maps represent isopotential surfaces of sweet-tasting proteins with +/- 2kT/e for positive (blue) and negative (red) potentials, respectively. Critical residues of the proteins for their sweetness are labeled. (B) Electrostatic potentials for the VFTM-CRDs of human (a and b) and squirrel monkey (c and d). The contour maps (a and c) represent isopotential surfaces of the receptors with +/- 4kT/e for positive (blue) and negative (red) potentials, respectively. The receptors are represented as molecular surfaces color coded by electrostatic potential (+/- 10kT/e).

