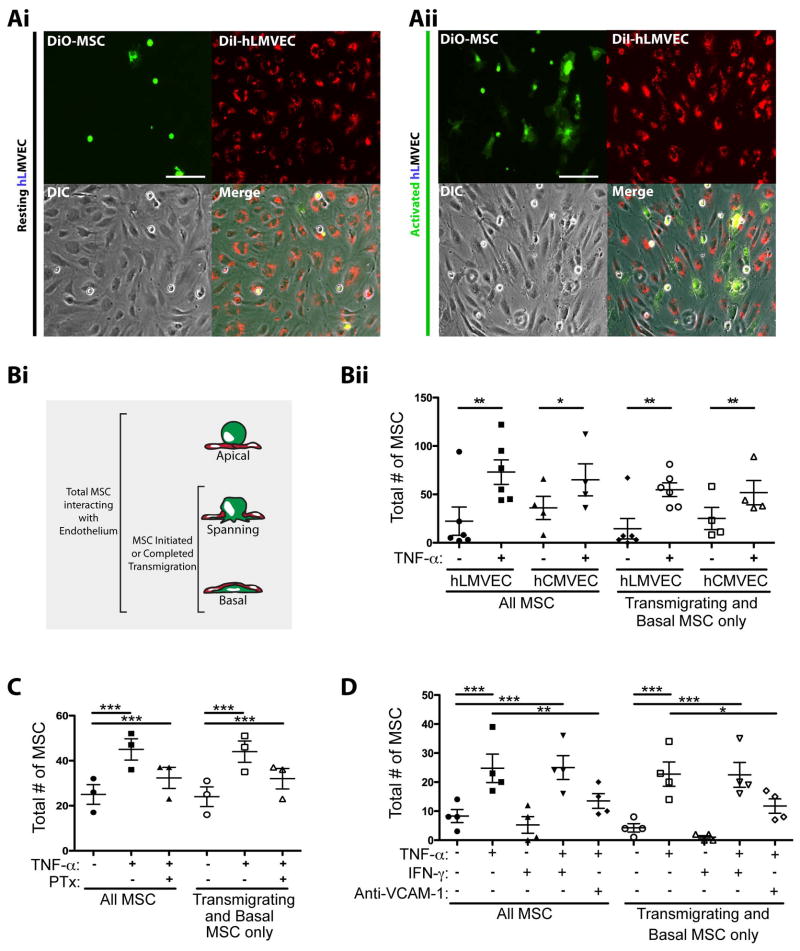
Figure 1. MSC preferentially transmigrate through TNF-α activated lung and cardiac endothelium.
(A) DiO-labeled MSC (green) were incubated on resting (i) or TNF-α activated (ii) DiI-labeled human lung microvascular endothelium (hLMVEC; red) for 60 min, followed by fixation and imaging by fluorescent and phase-contrast microscopy. Representative micrographs are shown. Scale bars represent 100 μm.
(B) MSC were incubated on resting or TNF-α activated hLMVEC and hCMVEC for 60 min, followed by fixation, staining and imaging by fluorescent confocal microscopy. (i) MSC were counted and classified according to their positions relative to endothelium: Apical, Spanning or Basal. (ii) Both the total number of MSC, and the number of MSC in only the transmigrating or basal positions were compared on TNF-α activated and resting endothelium for both hLMVEC and hCMVEC.
(C) MSC were incubated on resting or TNF-α activated hCMVEC for 60 min. In some cases, MSC were incubated with 100 ng/ml of pertussis toxin (PTX) for 2 h prior to be added to endothelium. As in B, both the total number of MSC, and the number of MSC in only the transmigrating positions were compared for all conditions.
(D) MSC were incubated on resting, or TNF-α activated and/or IFN-γ activated hCMVEC for 60 min. In some cases, TNF-α activated endothelium was incubated with 20 μg/ml blocking antibodies against VCAM-1 for 30 min prior to the addition of MSC. Samples were fixed, stained and imaged by fluorescent confocal microscopy. As in B, both the total number of MSC, and the number of MSC in only the transmigrating or basal positions were compared for all conditions.
For Bii, C and D, data were collected from at least 6 microscopic fields for each experimental condition. Values represent mean ± s.e.m.. 1, 2, or 3 asterisks indicate 3 levels statistically significant differences (p<0.05, p<0.01, and p<0.0001 respectively). For B, this was assessed by a two-tailed, paired Student’s t-test. For C and D, this was assessed by a one-way ANOVA test with a Tukey post-hoc test.

