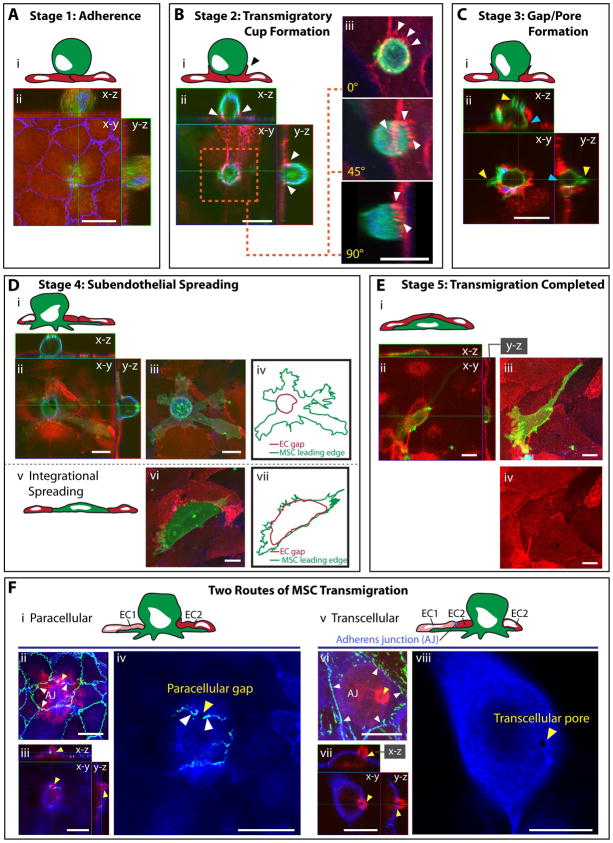
Figure 2. The 5 stages and 2 routes of MSC transmigration.
Five distinct stages (A–E) of transmigration were consistently observed for MSC, based on previously established leukocyte morphological analysis 19, presented as both schematics (Ai; Bi; Ci; Di, iv, v, vii; Ei; Fi, v; see also Fig. S1) and confocal projections (Aii, Bii–iii, Cii, Dii, iii, vi; Eii–iv; Fii–iv, vi–viii). Confocal projections include top (x–y) and orthogonal (x–z and y–z) cross-sections.
(A) Stage 1: Adherence. A relatively spherical MSC (CTx-B; green) is adherent to the apical surface of an intact GPNT monolayer as seen by ICAM-1(EC surface; red) and VE-cadherin (EC junctions; blue) staining.
(B) Stage 2: Transmigratory Cup Formation. VCAM-1-enriched microvilli-like vertical projections (white arrows) that extend up from hLMVEC endothelium (VCAM-1; red) and form a ‘cup-like’ structure around the base of the MSC (CD90; green) at 60 min. Actin is stained in blue. 3D projections (rotated 0°, 45° and 90° about y and z axes) are shown in (iii). See also Video 1.
(C) Stage 3: Gap/Pore Formation. A discrete hCMVEC endothelial discontinuity is occupied by the basal portion of an MSC in contact with the substrate (blue arrows) indicating initiation of transmigration at 60 min. Sample stained as in B. Note blebs extending from the MSC surface (yellow arrows).
(D) Stage 4: Subendothelial Spreading. A representative MSC is shown spreading beneath intact hLMVEC endothelium via a discrete gap. Orthogonal projections (ii) and a merged image (iii) is shown. This is in contrast to integration (schematic, v; orthogonal projection, vi), where MSC displace endothelial cells by spreading between adjacent EC. MSC leading edges and gaps in the EC are outlined in iv and vi to highlight the distinct endothelial gaps which are typically formed during transmigration through endothelium versus integration within an endothelial monolayer. Samples stained as in B.
(E) Stage 5: Transmigration Completed. Representative orthogonal views (ii) indicate an MSC completely under the endothelium at 60 min. Top view projections, with (iii) or without (iv) MSC shown, demonstrating intact endothelium.
(F) Two Routes of MSC Transmigration, paracellular and transcellular, are shown. MSC incubated on GPNT ECs for 60 min were fixed and stained for VE-cadherin (green), CTx-B (MSC; red) and ICAM-1 (blue). Representative images of MSC at similar late stages in diapedesis migrating either through a paracellular gap between two endothelial cells (i–iv) or through a transcellular pore across a single endothelial cell (v–viii). Images are either top view projections of entire z-stacks (ii, vi) or single sections alone (iv, viii) or together with orthogonal projections (iii and vii). The red MSC (CTx-B) signal was omitted for panels iv and viii to enhance visualization of the transmigration passageway. Note that in both events, only a small rounded portion of the MSC still remains above the endothelium. In ii–iv the MSC migrates through a small (~2 μm in diameter) paracellular gap (iii, yellow arrows) between two cells where the adherens junction (AJ, white arrows) has been disrupted. In vi–viii the MSC passes through a small (~1 μm in diameter) transcellular pore (vi, yellow arrow) distinct from intact adherens junctions (white arrows).
Scale bars represent 20 μm.

