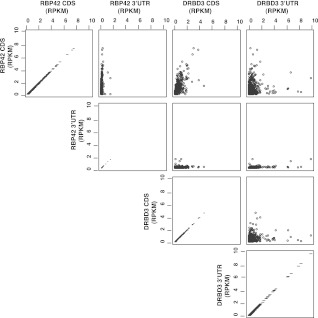
FIGURE 7.
A comparison of RBP42 and DRBD3 unique reads within the CDS and 3′ UTRs of 835 genes with defined 3′ UTRs. RBP42 and DRBD3 unique reads within the CDS and 3′ UTR of 835 genes were normalized over gene length and read counts to obtain RPKM (reads per kilobase per million mapped reads) values. Gene length for each gene was determined by adding CDS length and 3′ UTR length. The highest RPKM value obtained for RBP42 CDS regions was 7.4; for RBP42 3′ UTR region, 1.4; for DRBD3 CDS, 4.6, and for DRBD3 3′ UTR, 9.9. Pairwise comparisons of RPKM values for each protein over CDs and 3′ UTR regions are shown as a scatterplot matrix. The axes show the RPKM values for the reads mapped to the CDs and 3′ UTR in the RBP42 and DRBD3 experiments.

