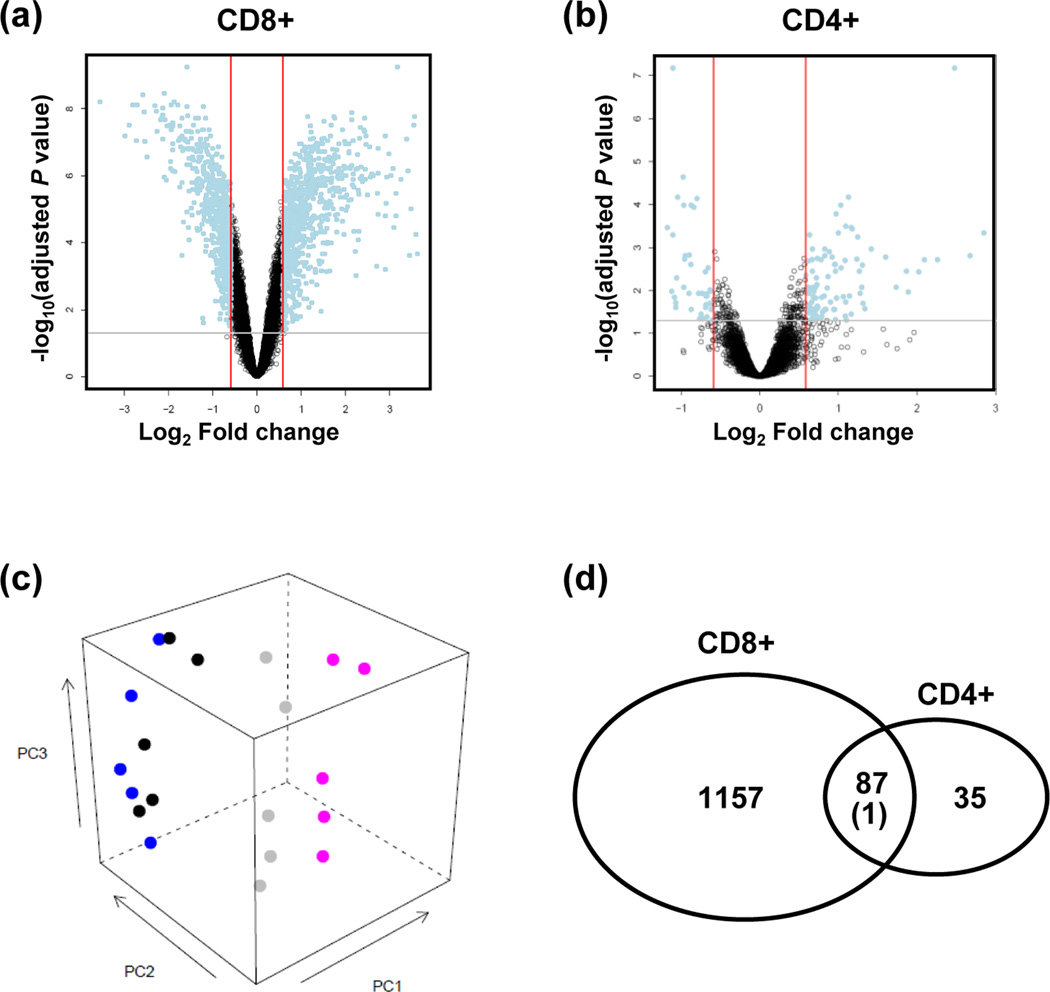
Figure 1.
The transcriptome of CD300a+ and CD300a− T lymphocytes. (a, b) Volcano plots showing the relationship between the FDR-corrected P values of the genes (−log 10 of) and their fold changes (log2 of). Blue dots outside the two red lines and above the gray line have fold changes >1.5 and FDR-corrected P values < 0.05. Positive values on the x-axis indicate genes whose expression increased in CD300+ T lymphocytes, while negative values indicate genes down-regulated in CD300a+ T lymphocytes. (a: CD8+ T lymphocytes; b: CD4+ T lymphocytes) (c) A principal component analysis plot generated with data from five pairs of samples (CD300+CD8+ (pink), CD300a−CD8+ (gray), CD300a+CD4+ (black), CD300a−CD4+ (blue) T lymphocytes), showing a more clear segregation between CD300a+CD8+ and CD300a−CD8+ than between CD300a+CD4+ and CD300a−CD4+ T lymphocytes. (d) Among the differentially expressed genes between CD300a+CD8+ and CD300a−CD8+ T lymphocytes, 87 genes were regulated in the same direction as those expressed differentially between CD300a+CD4+ and CD300a−CD4+ T lymphocytes. Far more significantly enriched genes (N = 1,157) were identified in the CD8+ T lymphocytes with CD300a expression, while only 35 more genes were differentially regulated in the CD4+ T lymphocytes with CD300a expression.

