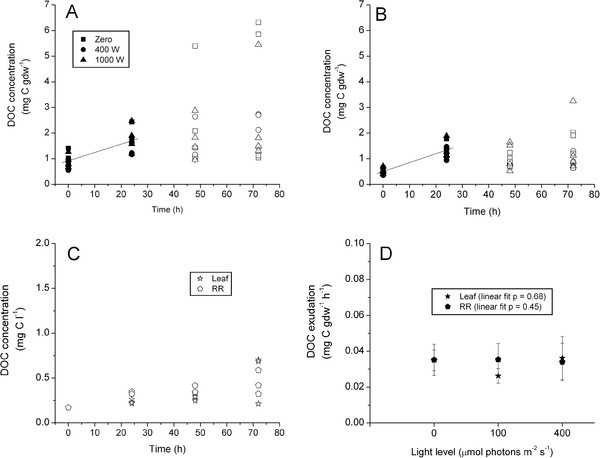
Figure 2.
Light Experiment. Plot and regression analysis of DOC concentration (mg C gdw-1) versus time for leaf (A) and rhizome + root (B) tissues pooled over treatments. Treatments are denoted by symbol shape; open symbols were not included in the regression. DOC concentration (mg C l-1) versus time for the control chambers (C) pooled over light treatments. Leaf and Rhizome + Root DOC exudation rate (D) versus irradiance; linear regressions were fit to the data, probability values are presented. Note difference in units and Y-axis scaling between plots.

