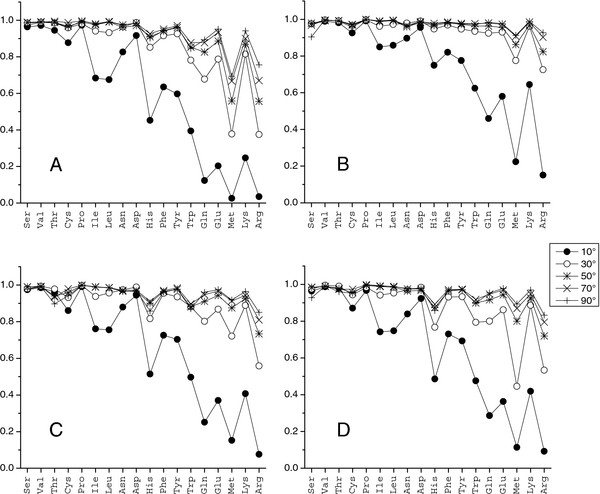
Figure 3 .
Correlation between dihedral angle distributions. (A) Interface bound vs. unbound, (B) non-interface bound vs. unbound, (C) non-interface vs. interface unbound, and (D) non-interface vs. interface bound. For each grid spacing, 100 tests were performed with random splitting point. The plot shows the average correlation value.

