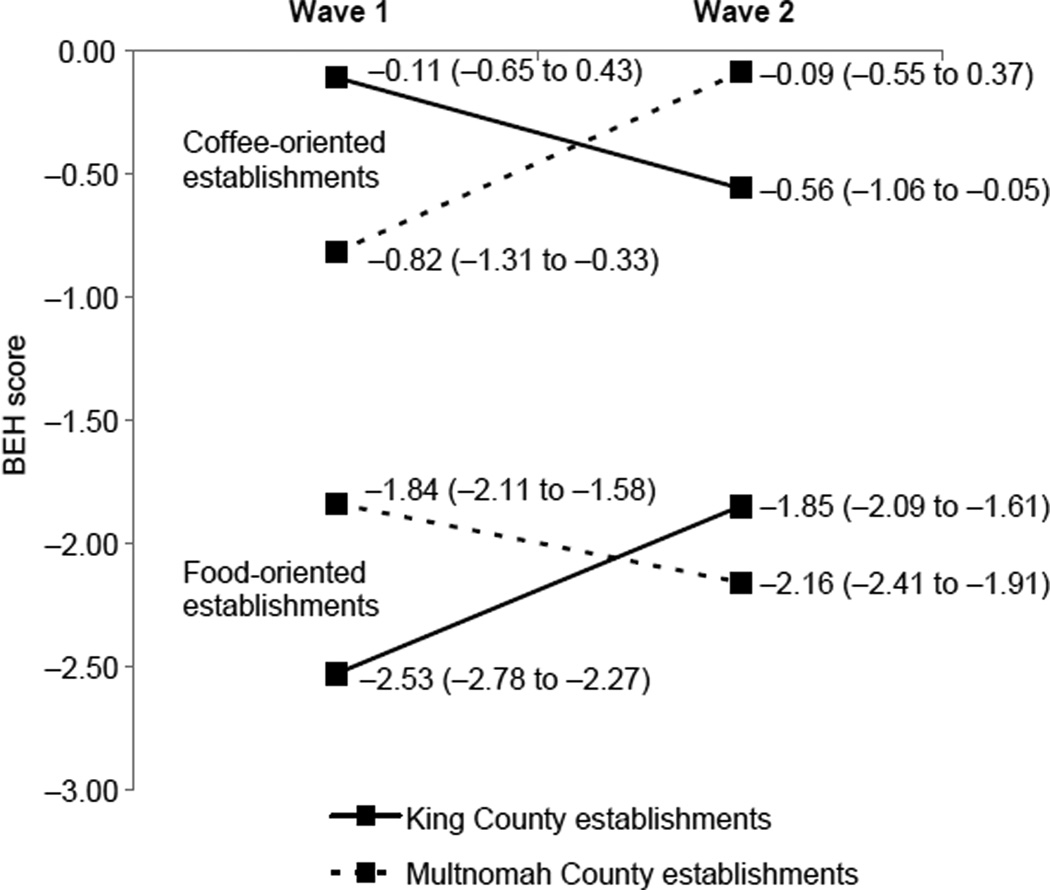
Figure 1.
Barriers to healthful eating before and soon after nutrition-labeling regulation and in King County WA
Note: Data are for coffee- versus food-oriented King County WA and Multnomah County OR restaurants. Wave-1 data are before regulation; Wave-2 data are soon after regulation. Lessnegative (higher) BEH scores indicate fewer barriers to healthful eating (e.g., no signage/promotion of unhealthy or overeating. Appendix A (available online at www.ajpmonline.org) provides a complete list of NEMS-R BEH items); n=9 and n=11 for King and Multnomah County coffee establishments and n=40 and n=38 for King County and Multnomah County food establishments, respectively.
BEH, NEMS-R Barriers to Healthful Eating scale; NEMS-R, Nutrition Environment Measures Surveys, restaurant version

