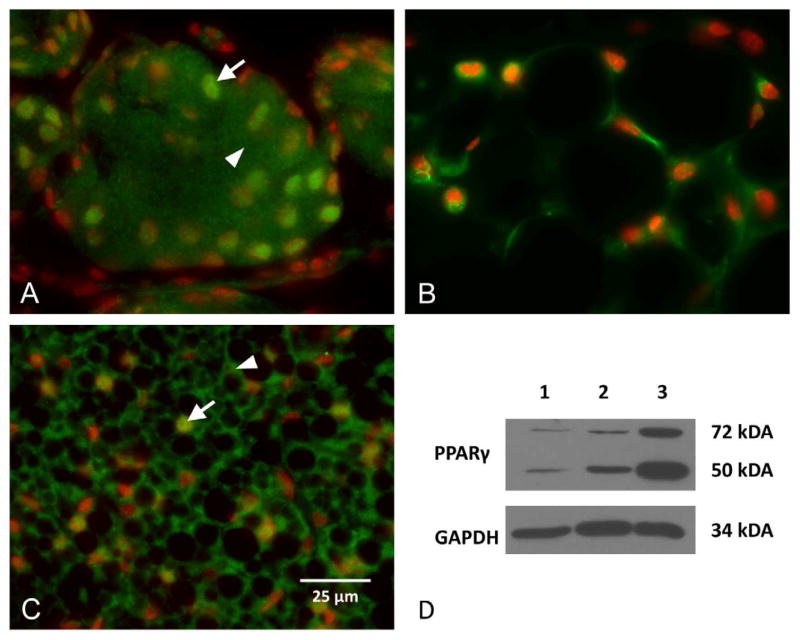
Figure 3.
PPARγ (Green) and nuclei (DAPI, Red) staining of meibomian gland acini (A), white fat (B), and brown fat (C). Note that PPARγ stains both the nuclei (arrow) and cytoplasm (arrowhead). Western blotting (D) identifies both a 50 kDa and 72 kDa proteins in all three tissues (lane 1 = meibomian gland, lane 2 = white fat, lane 3 – brown fat). (Adapted from Nien et al.8)

