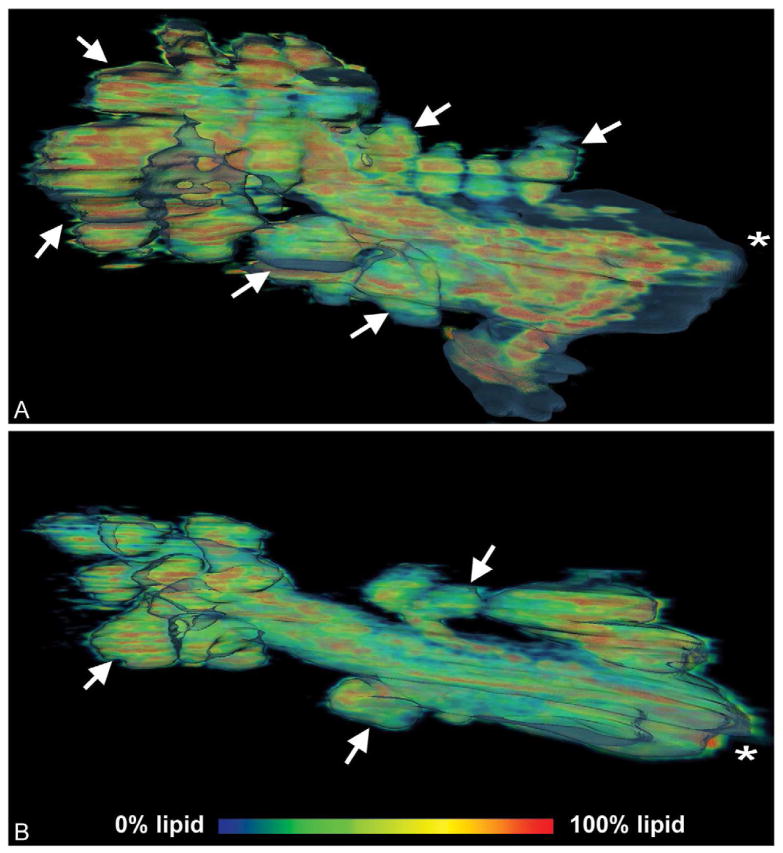
Figure 4.
Meibomian gland lipid volume heat map of 2-month-old gland (A) and 2-year-old gland (B). Lipid components are seen in red to blue and represent a voxel volume of 100% to 0% lipid, respectively. Note the loss of acini (arrows) in the older gland (B) compared to the younger gland (A). (Adapted from Jester et al.11)

