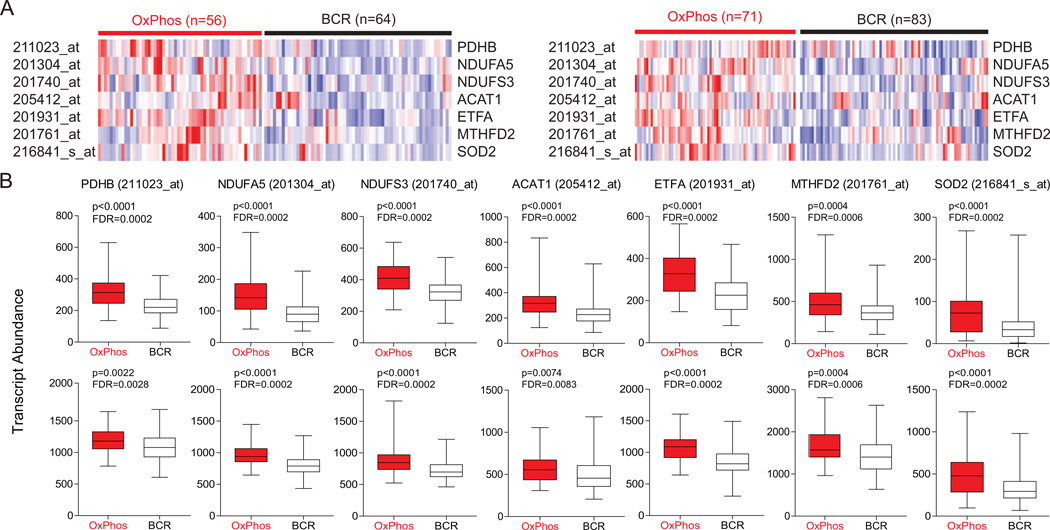
Figure 2. Increased Abundance of Transcripts Encoding Mitochondrial Proteins in Primary DLBCL Tumor Biopsies.
(A) Heat map representation of the relative mRNA levels of genes corresponding to the components of the mitochondrial proteome signature using the Monti et al. (left) and Lenz et al. (right) expression array data sets of primary DLBCL cases with OxPhos and BCR consensus cluster assignments.
(B) Transcript abundance (probe intensity) of the indicated genes in primary OxPhos- and BCR-DLBCLs from the Monti et al. (top) and Lenz et al. (bottom) data sets. Differential expression was determined by a two-sided Mann Whitney test and p values were corrected for multiple hypothesis testing using the false discovery rate (FDR) procedure.
Abbreviations: PDH, pyruvate dehydrogenase; NDUFA5, NADH dehydrogenase (ubiquinone) 1α subcomplex subunit 5; NDUFS3, NADH dehydrogenase (ubiquinone) Fe-S protein 3; ETF, electron-transfer-flavoprotein; ACAT, acetoacetyl-CoA thiolase; MTHFD2, methylenetetrahydrofolate dehydrogenase 2; SOD2, manganese superoxide dismutase.
See also Tables S2 and S3.

