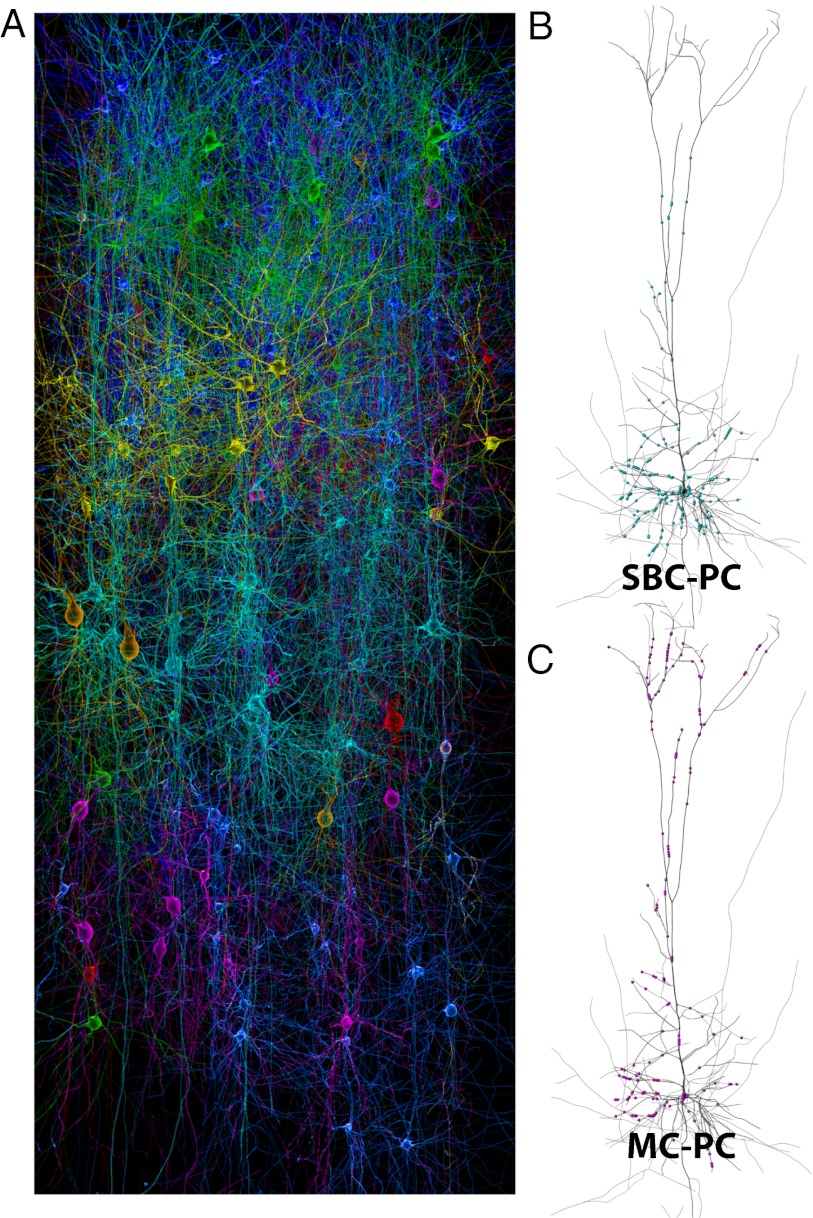
Fig. 2.
Cell type-specific domain specificity from statistical connectivity. (A) A model neocortical microcircuit illustrating some of the different pyramidal and interneuron morphologies used and arranged in five layers. Each morphological type is colored differently. (B) Incidental appositions (blue dots) formed by a population of SBCs on a single representative PC. (C) Incidental appositions (purple dots) formed by a population of MCs on the same PC as in B.

