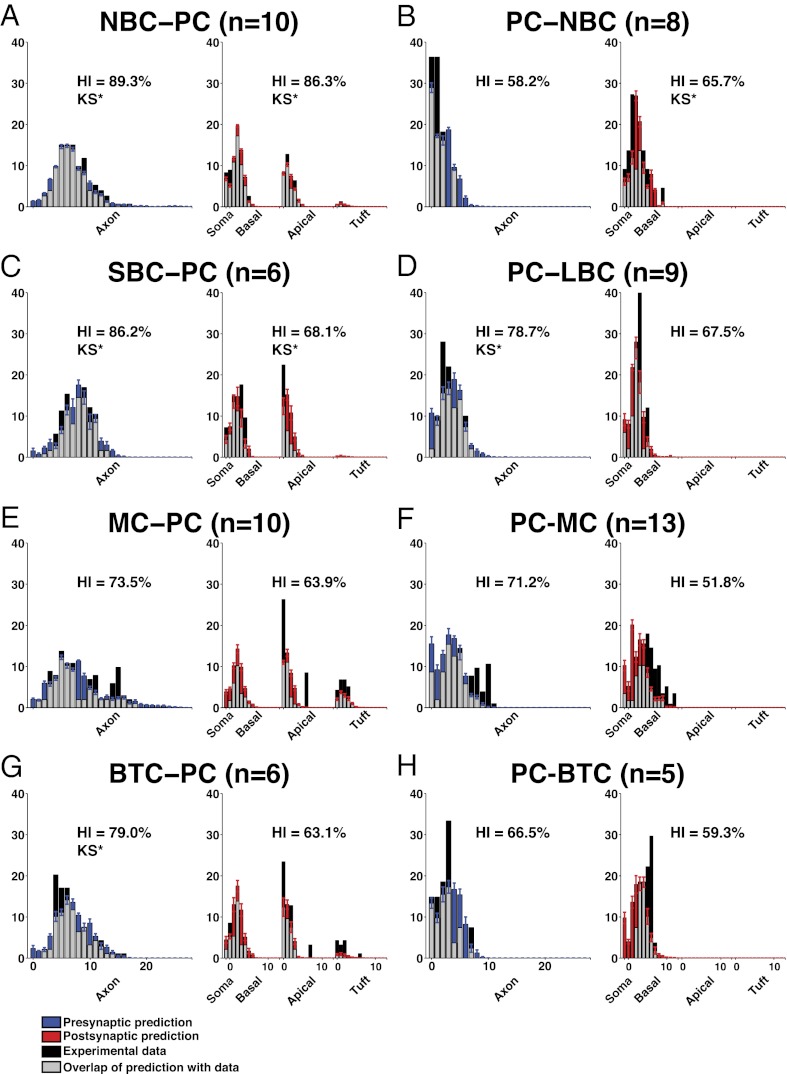
Fig. 4.
Comparison of experimental and predicted innervation patterns for different types of connection. The color code is the same as in Fig.3. Innervation patterns (mean ± SEM; over apposition distances = 0–4 μm) according to branch order. (A) Experimental and predicted innervation patterns for NBC to PC. (B) PC to NBC. (C) SBC to PC. (D) PC to LBC. (E) MC to PC. (F) PC to MC. (G) BTC to PC. (H) PC to BTC. KS* indicates significant Kolmogorov-Smirnov equality (α < 0.05).

