
Table 1.
Mean error and histogram intersection for experimental and predicted innervation patterns
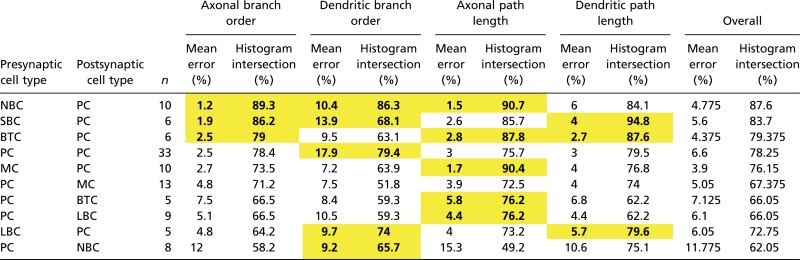 |
Predicted and biological distributions that are considered equivalent are in yellow and bold (KS test; α = 0.05).
Official websites use .gov
A
.gov website belongs to an official
government organization in the United States.
Secure .gov websites use HTTPS
A lock (
) or https:// means you've safely
connected to the .gov website. Share sensitive
information only on official, secure websites.
Mean error and histogram intersection for experimental and predicted innervation patterns
|
Predicted and biological distributions that are considered equivalent are in yellow and bold (KS test; α = 0.05).