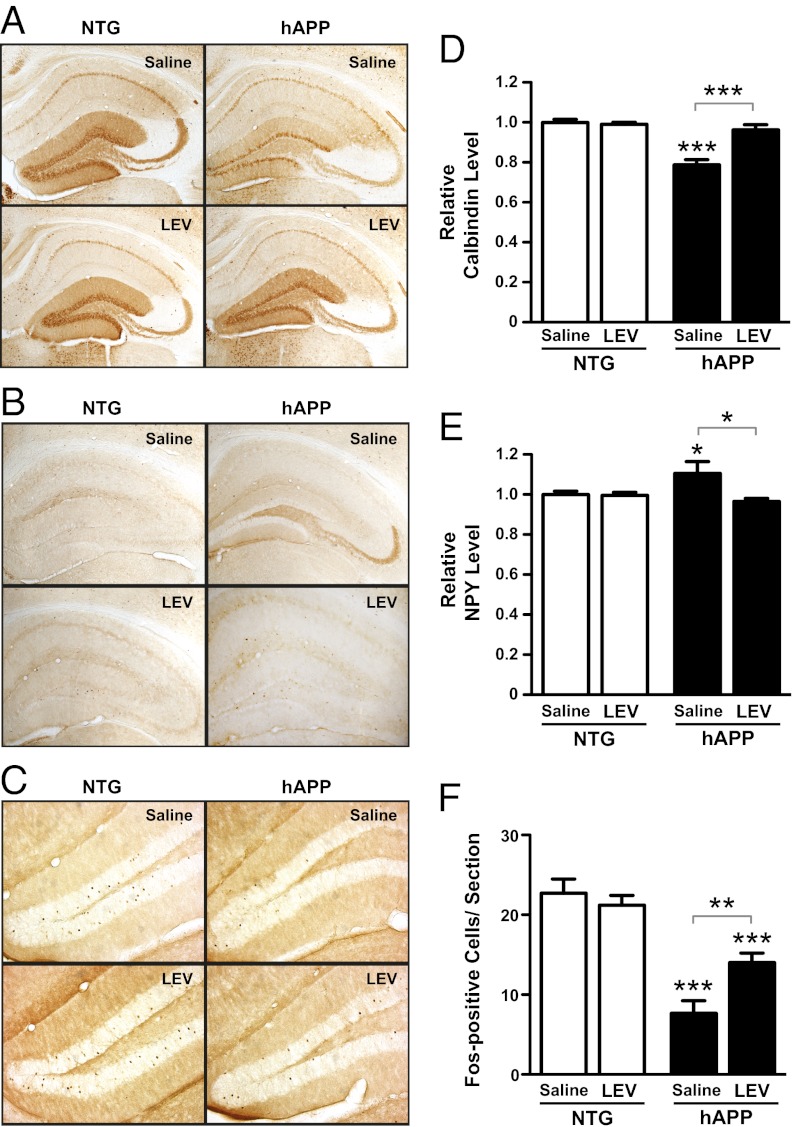
Fig. 5.
LEV reverses abnormalities in synaptic activity-related proteins in the dentate gyrus of hAPP mice. Coronal brain sections from NTG and hAPPJ20 mice treated s.c. with saline or LEV (75 mg⋅kg−1⋅d−1) for 28 d (n = 12–16 mice per genotype and treatment) were immunostained for calbindin, NPY, or Fos. (A–C) Photomicrographs illustrating calbindin (A), NPY (B), and Fos (C) alterations in saline-treated hAPP mice and normalization of these biomarkers in LEV-treated hAPP mice. The relative densitometric measures obtained for the sections shown in this figure were 1.06 (NTG/saline), 0.97 (NTG/LEV), 0.71 (hAPP/saline), 1.04 (hAPP/LEV) for calbindin (A) and 1.05 (NTG/saline), 0.97 (NTG/LEV), 1.23 (hAPP/saline), 1.01 (hAPP/LEV) for NPY (B). (D and E) Densitometric quantitation of calbindin in the molecular layer of the dentate gyrus (D) and of NPY in the mossy fiber pathway (E). (F) Quantification of Fos-immunoreactive cells in the granular layer of the dentate gyrus. Two-way ANOVA revealed a significant interaction between genotype and treatment: (D) P = 0.0001; (E) P = 0.029; (F) P = 0.005. *P < 0.05, **P < 0.005, ***P < 0.0005 vs. saline-treated NTG or as indicated by bracket (Bonferroni test). Values in D–F are mean ± SEM.

