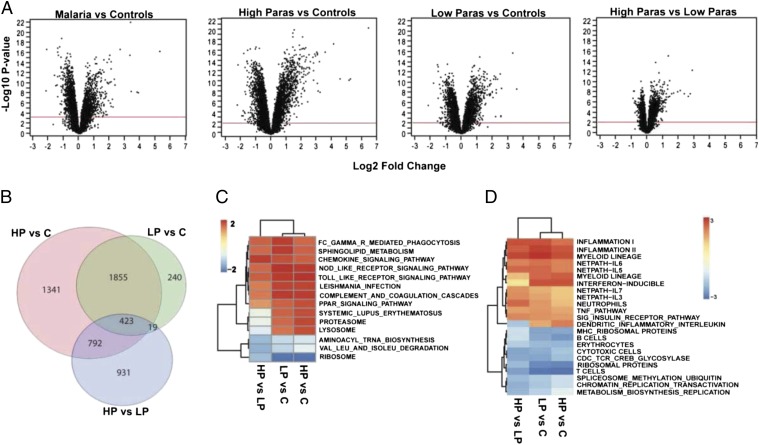
Fig. 2.
Differential expression in whole-blood transcriptome. (A) Volcano plots of statistical significance vs. magnitude of differential expression for the two-way contrasts between the controls (marked as “C”) and high parasitemia (HP) and low parasitemia (LP) groups. For each transcript, significance is shown as the –log10 P value on the y axis, and the log2 of magnitude of mean expression difference is on the x-axis. The red horizontal line indicates the 1% FDR threshold. (B) Venn diagram shows numbers of differentially expressed transcripts for each comparison and the overlaps between them. For each contrast, GSEA was performed for KEGG pathways (C) and the C2, C3, and C5 collections of the Molecular Signatures Database (D) as previously described (9, 16). Only pathways and modules significantly enriched (Bonferroni-adjusted P < 0.05) from at least one contrast are shown. Colors in the heat map indicate the enrichment score from the GSEA analysis.

