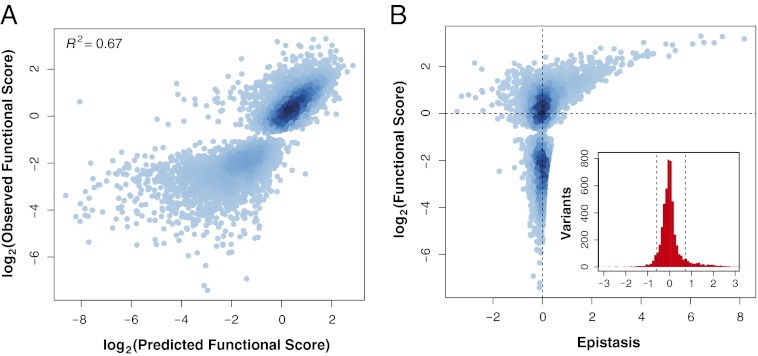
Fig. 1.
Relationship between function and epistasis in a massive collection of double mutants. (A) The functional score of 5,010 doubly mutated variants was predicted from the functional scores of the component singly mutated variants using the product model. Predicted functional score is plotted against observed functional score and the two are highly correlated (Pearson’s R2 = 0.67). For each doubly mutated variant, the linear models used to generate the functional score had an R2 ≥ 0.75. (B) Epistasis scores calculated using the product model for the 5,010 variants are plotted against the functional score of the doubly mutated variant. The distribution of epistasis scores is shown in the Inset. Dashed lines are placed at ±1 SD from the mean.

