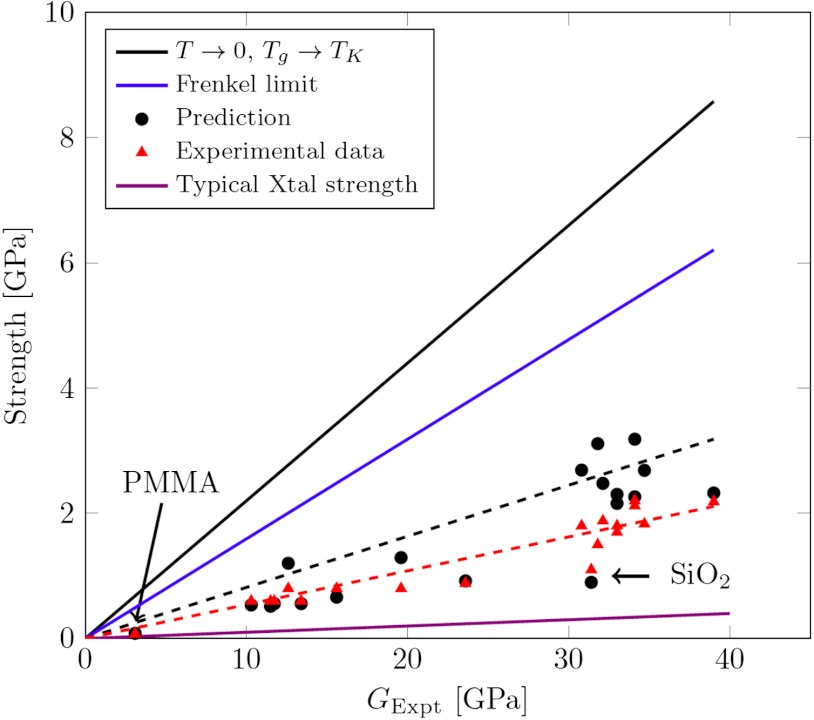
Fig. 4.
Strength as a function of shear moduli. The experimental strength (red triangle) and the predicted strength (black circle) have nearly the same slope and are quite different from Frenkel strength (blue solid line). Typical value of crystal strength (violet solid line) and strength in the limit T → 0,Tg → TK (black solid line) are also shown in comparison.

