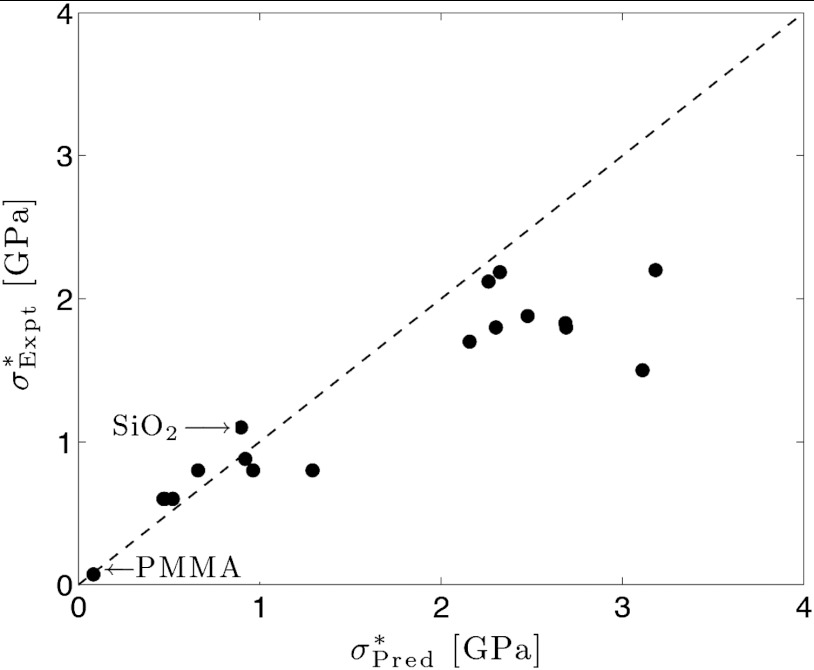
Fig. 5.
A plot of the strength, σ∗, measured from the experiments versus theoretical estimation derived from the RFOT theory. The dotted line plots the perfect match between the experiments and the predictions,  . The experimental data used are shown in Table S1.

