Fig. 1.
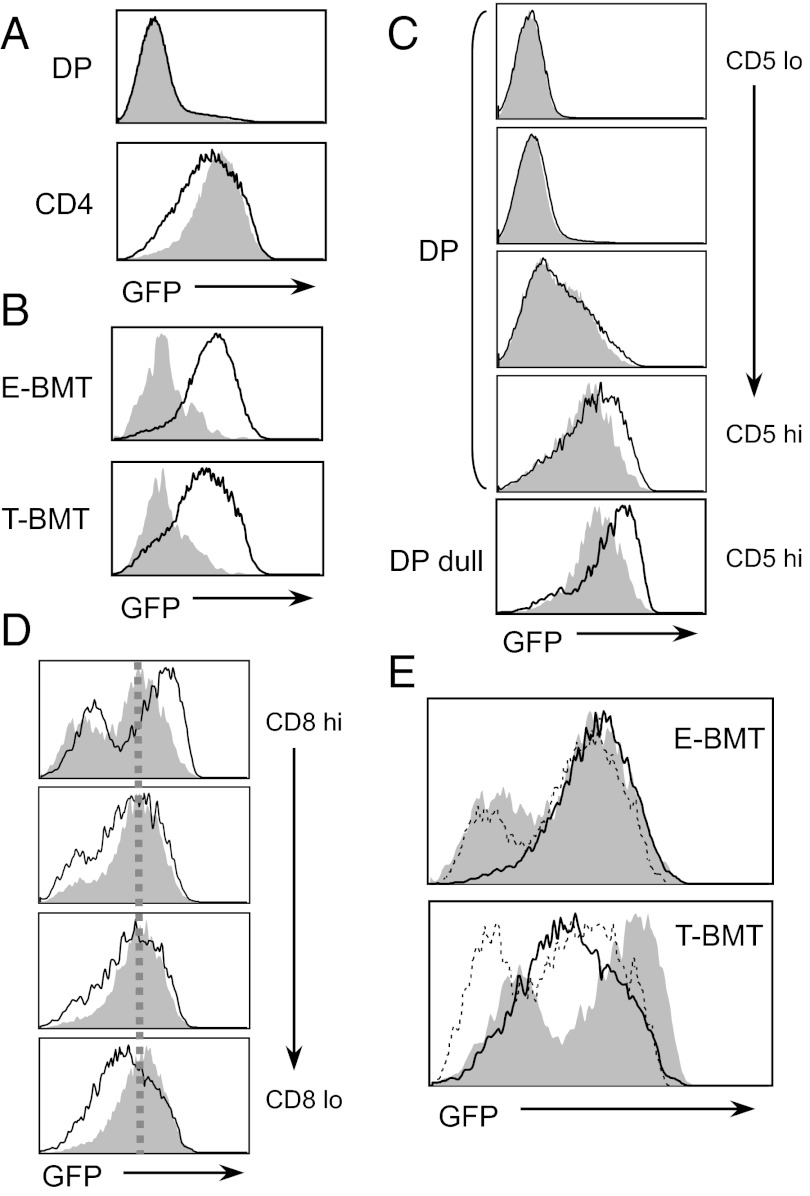
Stronger TCR signaling for T-CD4 than E-CD4 T-cell development. (A) Level of GFP on DP cells and CD4 SP thymocytes from E- or T-BMT mice. Shaded and line histograms indicate cells from E- and T-BMT mice, respectively. (B) GFP levels of iNKT cells (shaded) were compared with E- or T-CD4 SP thymocytes (line). (C) Higher GFP expression on CD5hi DP cells and DP dull thymocytes from T-BMT than E-BMT mice. CD5 expression and gating of those cells are shown in Fig. S1B. Shaded and line histograms indicate cells from E- and T-BMT mice. (D) Decrease in GFP expression in T-CD4 SP thymocytes as they mature. CD4 SP thymocytes were divided based on the level of CD8 in E- and T-CD4 T cells and GFP expression of those cells was examined. Shaded and line histograms indicate cells from E- and T-BMT mice. (E) GFP levels on three different stages of E- or T-CD4 T cells were compared. Shaded, DP dull; dotted line, CD8hi CD4 SP thymocytes; solid line, CD8lo CD4 SP thymocytes. Data are representative of 6 E-BMT and 10 T-BMT mice.

