Fig. 2.
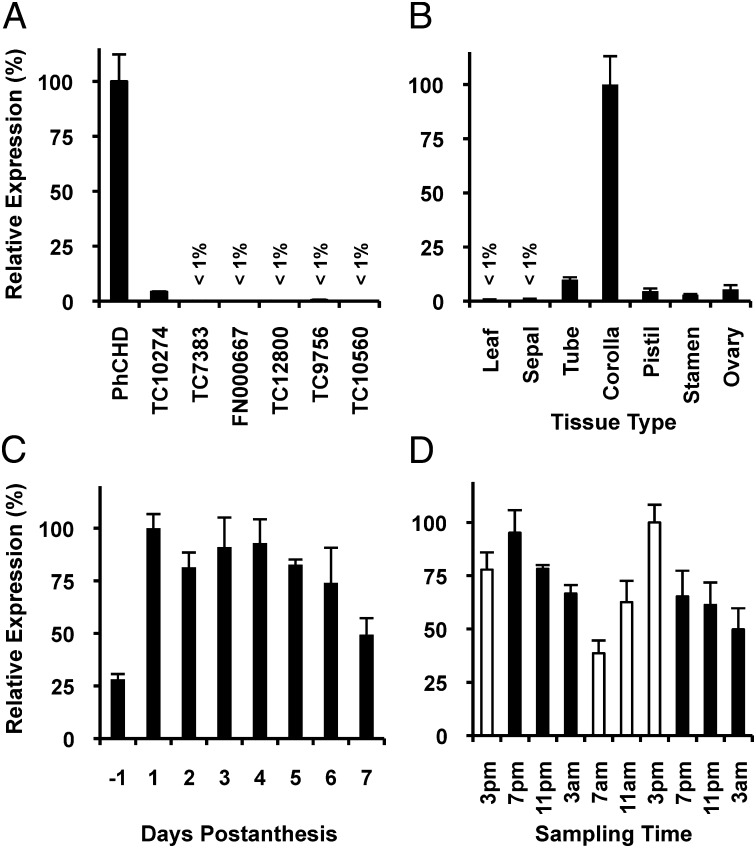
Expression profiles of PhCHD and the six other petunia MFP candidates. (A) Expression of MFP candidates in petunia corollas collected at 3:00 PM on day 2 postanthesis shown relative to the highest expressed candidate, PhCHD. (B) Tissue-specific expression of PhCHD in flowers at 3:00 PM day 2 postanthesis and leaves shown relative to transcript level in corolla. (C) Developmental PhCHD expression profile at 3:00 PM days −1 through 7 postanthesis shown relative to transcript level on day 1. (D) Rhythmic changes in PhCHD expression in corollas of flowers 3:00 PM day 1–3:00 AM day 3 postanthesis during a normal light/dark cycle shown relative to the transcript level at 3:00 PM on day 2. Black and white bars correspond to dark and light periods, respectively. All transcript levels were determined by qRT-PCR either in relation to the reference gene elongation factor 1-α (A) or as absolute amounts based on quantification from a PhCHD DNA standard (B–D). All data are means ± SEM (n = 3–4 biological replicates).

