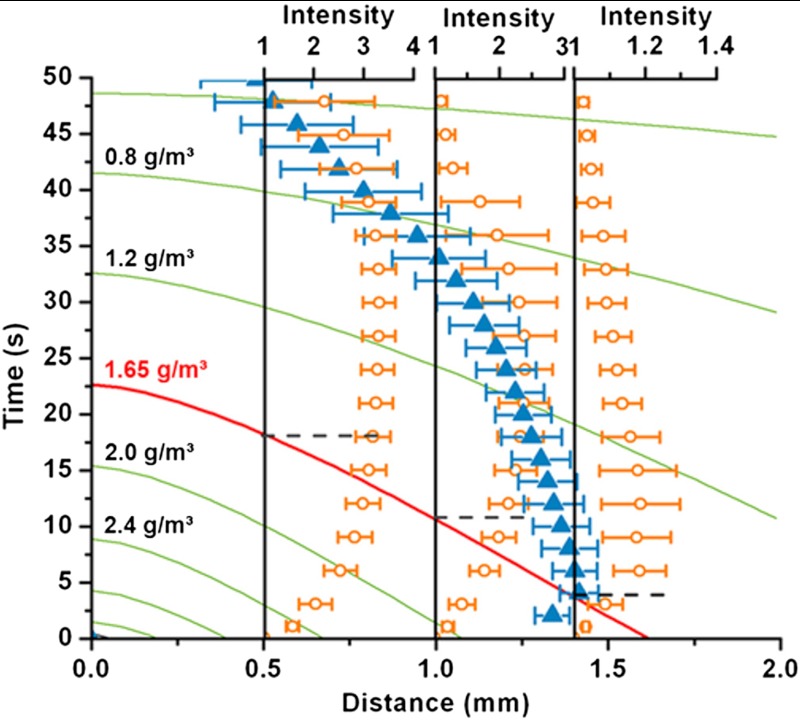
Fig. 2.
Phase change around a freezing supercooled droplet on PMMA surface. The numerically computed contour plot of water vapor mass concentration (in g/m3) variation at the substrate, along a radial line from the edge of the droplet (origin of the distance coordinate) due to evaporation are plotted as solid lines. The red contour line indicates the saturation concentration at -14.5 °C. The blue triangles indicate the outer boundary of water vapor condensation halo (experiment); i.e. the extent of the condensate. Topmost blue triangle marks the point at which the condensate is completely frozen. The orange circles show the locally averaged and normalized gray scale intensity values for three particular different distances (0.5 mm, 1.0 mm, and 1.4 mm) from the water droplet contact line. The intensities should correspond one to one with the size of the condensate microdroplets (see details in the text). The switching times (switch from supersaturation to undersaturation condition) for the three locations are indicated using horizontal dashed lines. The error bars reflect the standard deviation over four measurements.

