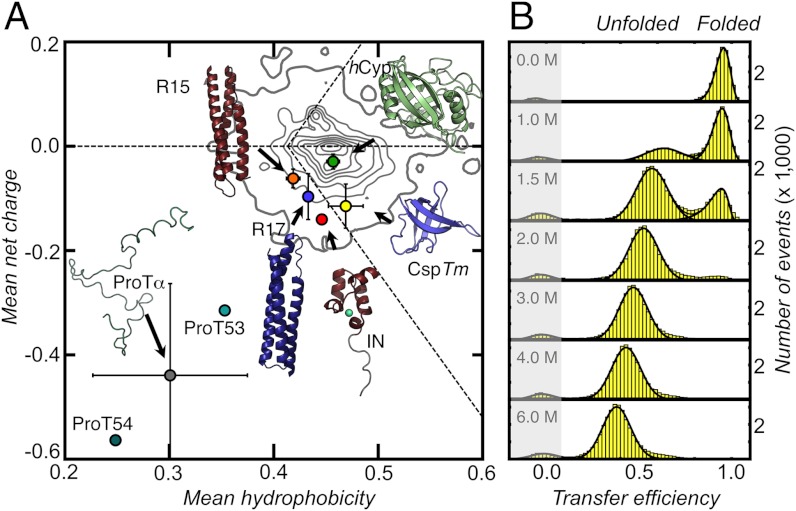
Fig. 1.
Structures and amino acid compositions of the proteins used in this study (A) and single-molecule FRET efficiency histograms for CspTm (Csp66, SI Appendix, Table S1) at different concentrations of GdmCl (B). (A) Mean net charge, including the charges of the attached fluorophores, versus mean hydrophobicity per residue for hCyp, CspTm, R15, R17, IN, and ProTα (variants ProT53 and ProT54, SI Appendix) (circles). Error bars are standard deviations of mean net charge and mean hydrophobicity of the different variants of each protein. The density plot represents the distribution of 10,905 monomeric proteins with a sequence similarity ≤ 30% taken from the Protein Data Bank. The horizontal dashed line indicates a mean net charge of zero. Diagonal dashed lines indicate the separation line between intrinsically disordered and folded proteins suggested by Uversky et al. (48).

