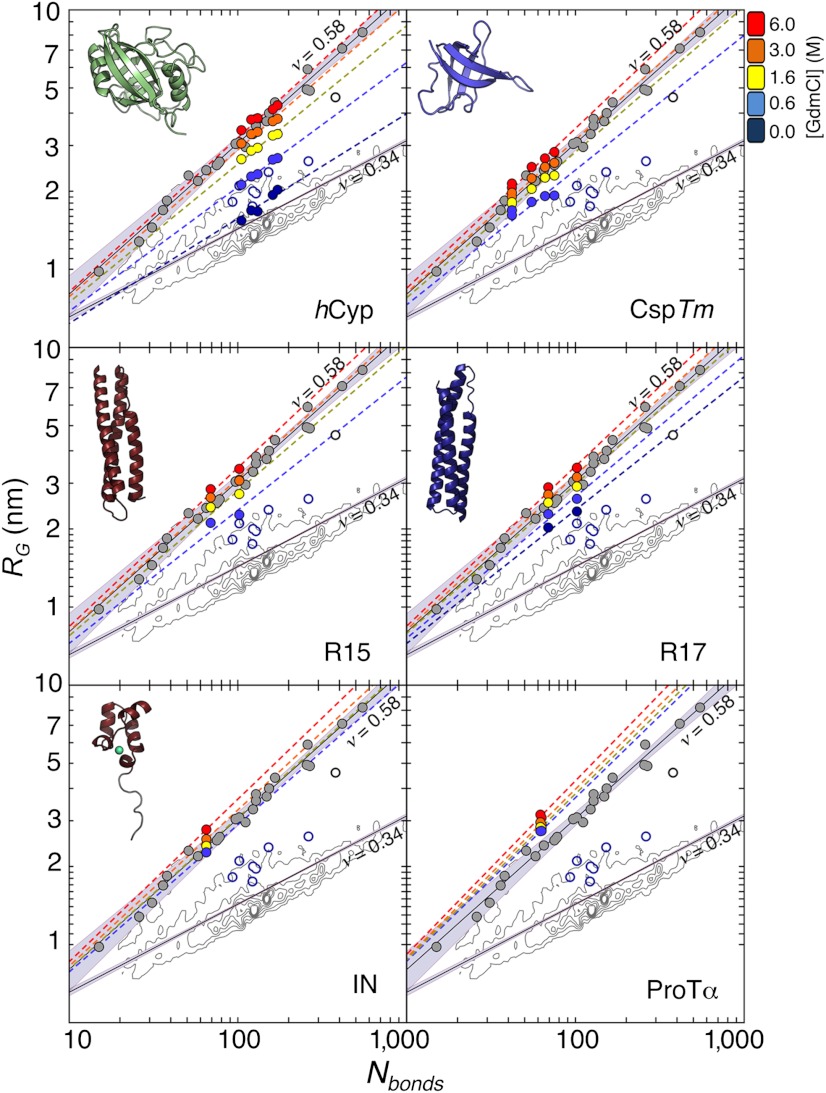
Fig. 2.
Radius of gyration, RG, for all proteins and variants as a function of the number of bonds, Nbonds = N + l, at different GdmCl concentrations (see color scale). Each dye linker was estimated to be equivalent to 4.5 peptide bonds (l = 9) (61). Colored dashed lines are fits according to Eq. 3 with  . The contour plots represent the distribution of RG values for the folded proteins shown in A. Gray circles are the RG values determined for unfolded proteins via SAXS, taken from Kohn et al. (40). Open blue circles are RG values of denatured proteins under native conditions determined with SAXS, taken from Uzawa et al. (30). Black solid lines are fits of the data taken from Kohn et al. (40) and of the 10,905 monomeric native proteins from the Protein Data Bank with Eq. 3. The resulting scaling exponents are indicated.

