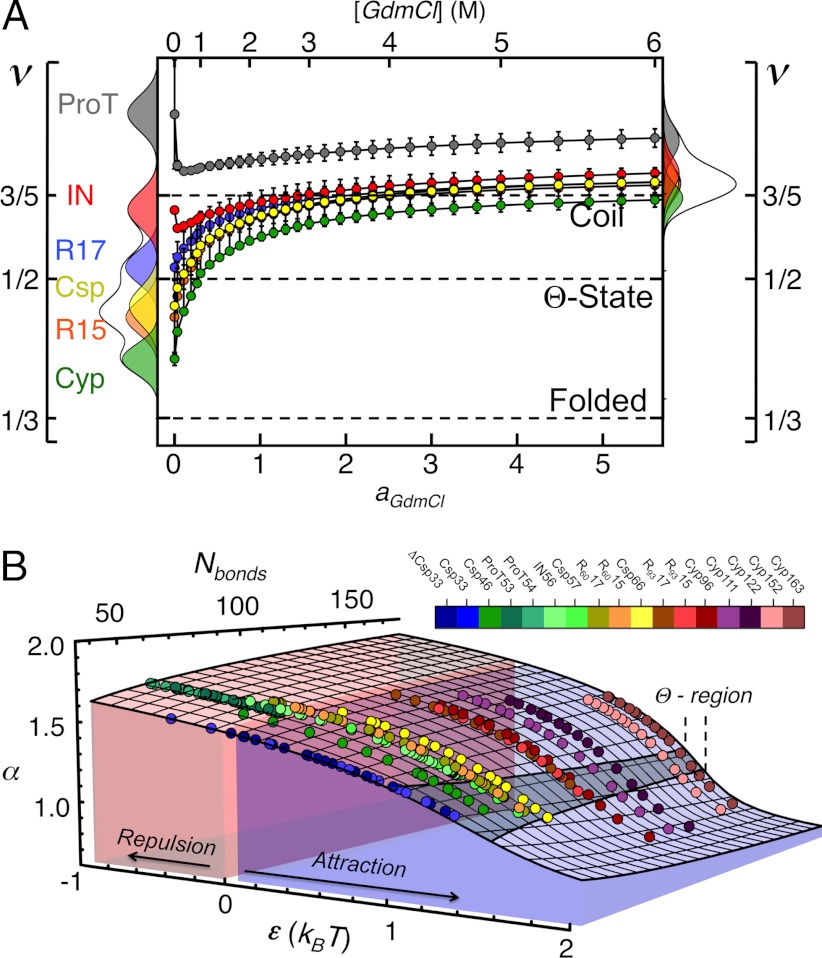
Fig. 3.
Scaling exponents (A) and phase transition surface (B) for the unfolded proteins and variants of this study. (A) Error bars represent the uncertainties of the fits shown in Fig. 2, and the distributions in water (Left) and 6 M GdmCl (Right) reflect the changes in the scaling exponents upon variation of  by ± 10% around its estimated value of 0.40 nm. (B) Comparison between experimentally determined expansion factors α (filled circles) for all variants and proteins of this study and the numerically computed expansion factors α with our estimate for RGΘ using Eq. 1. Shaded volumes indicate the regimes of attractive (ε > 0) and repulsive (ε < 0) intrachain interaction energies. The gray shaded region indicates the transition regime between αc = 1, the critical value for infinitely long chains, and αc = 1 + (19/22)ϕ0, the approximation for finite chains as given by Sanchez (21). Here, ϕ0 is the volume fraction of the Θ-state relative to the most compact state (SI Appendix).

