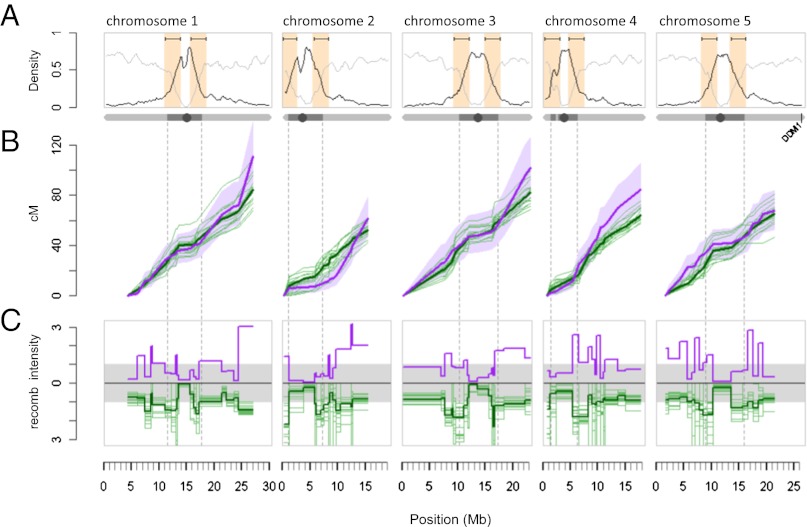
Fig. 2.
Comparison of global and local recombination patterns in the epiRILs and the 17 F2 populations (24). (A) Chromosome-wide gene (light gray line) and transposon (dark line) density distribution. The 3-Mb windows bracketing the intersection points between transposon- and gene-dense regions are indicated in orange. (B) Cumulative cM lengths of the epiRILs (thick purple line) and each of the F2 populations (thin green lines) using the consensus map. Purple shading shows the ±95% confidence interval (CI).The thick green line denotes the average F2 cumulative length (in cM). The dotted vertical lines define the pericentromeric regions of each chromosome. (C) The distribution of normalized recombination intensities (cM/Mb of a given marker interval divided by the cM/Mb chromosome average) shows suppression of recombination within pericentromeric regions and elevation at its boundaries. Color coding is as in B.

