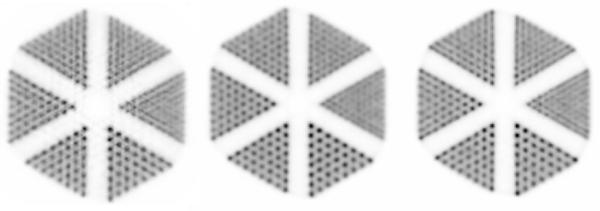
Figure 9.
Comparison of the simulated γγ hot-rod in-air phantom reconstructed with the ray-tracing OSEM-2D (left), iso-Gaussian (middle) and LOR-PDF (right) algorithms. All images were summed over 60mm in axial direction to reduce statistical noise. Each image is scaled to its in-plane maximum. These settings also apply to Figures 10-12.

