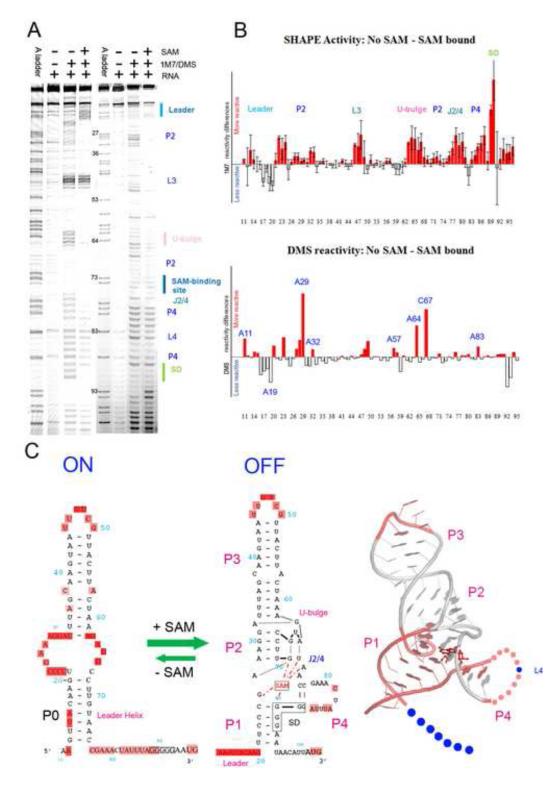
Figure 1.
SHAPE and DMS probing of the apo and SAM-bound SMK RNA. (A). SHAPE (lanes 2-4) and DMS (lanes 6-8) chemical probing reactions separated by sequencing gel electrophoresis. Structural motifs were marked on the right. Lanes 1and 5, ddTTP sequencing revealing the adenosine positions, which are one-nucleotide higher than the chemical probing lanes. Adjusted base register was indicated next to lane 5. (B). Quantified reactivity profile revealed structural changes upon SAM binding. Upper panel: SHAPE analysis; lower panel: DMS probing analysis. Upward red bars represent protected residues due to SAM-induced structure formation. Grey downward bars represent exposed bases upon SAM-binding. Residue numbers are indicated on the X-axis. Standard deviations were generated from five sets of independent measurements. (C). Left: Secondary structure models of the ON and OFF states based on the chemical probing analysis. Flexible regions in each state are highlighted in pink ovals. The five consecutive Gs in solid black boxes indicate the ribosome binding sites (SD sequence). SAM is shown in red. SAM-mediated tertiary interactions are shown as red dotted lines. Right: SHAPE reactivity differences mapped onto the crystal structure of the SAM-bound SMK box riboswitch 20. Residues in pink are protected upon SAM-binding in SHAPE, in blue are exposed. Leader sequence is presented by dots because it is not included in the crystal structure. The 11-nt L4 loop is also shown in dots because it was converted to a GAAA tetraloop in the crystal structure. It was slightly protected upon SAM-binding because it was constrained from ss-RNA to a loop. The extremely reactive L3 loop also showed slight protection upon SAM-binding presumably due to scaling artifact. In the crystal structure P3 was shortened and L3 was replaced with a GAAA tetraloop.

