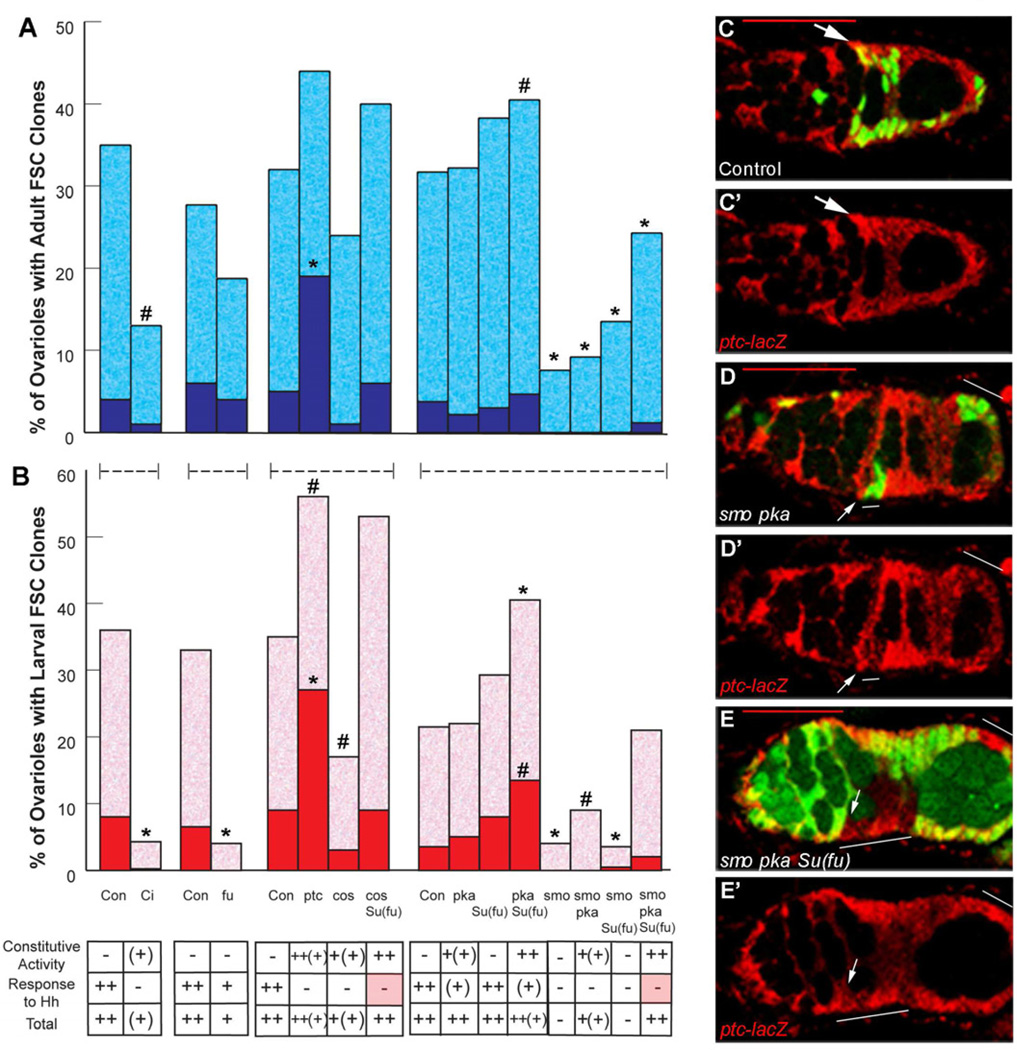
Figure 3. Hh pathway activity in FSCs must be high and precise but need not be higher than in daughters.
(A, B) Percentage of ovarioles retaining marked FSC clones 14 days after induction in (A) adults (blue) or (B) larvae (red), with dark colors indicating “all-marked” clones for FSCs lacking function of the indicated Hh signaling pathway components and controls (Con). At the bottom, the resulting strength of constitutive pathway activity, response to Hh and the sum of both are indicated based on extensive studies in wing discs. Statistical differences from control values calculated by Fisher’s two-tailed test are indicated as p<0.0001 (*) or p<0.01 (#). (C-E) Hh pathway activity is reported here by staining β-galactosidase (red) from a ptc-lacZ transgene, shown alone (C’–E’) or together with FSC clone markers (green in C–E). Hh pathway activity is (C, C’) slightly higher in a wild-type FSC (arrow) than in more posterior daughters, (D, D’) reduced in the FSC (arrow) of a positively-marked smo pka clone (green; white line) and (E, E’) high and uniform among the FSC and daughters of a negatively-marked (no green; white line) smo pka clone in Su(fu) mutant animals. Red scale bars represent 25µm.

